


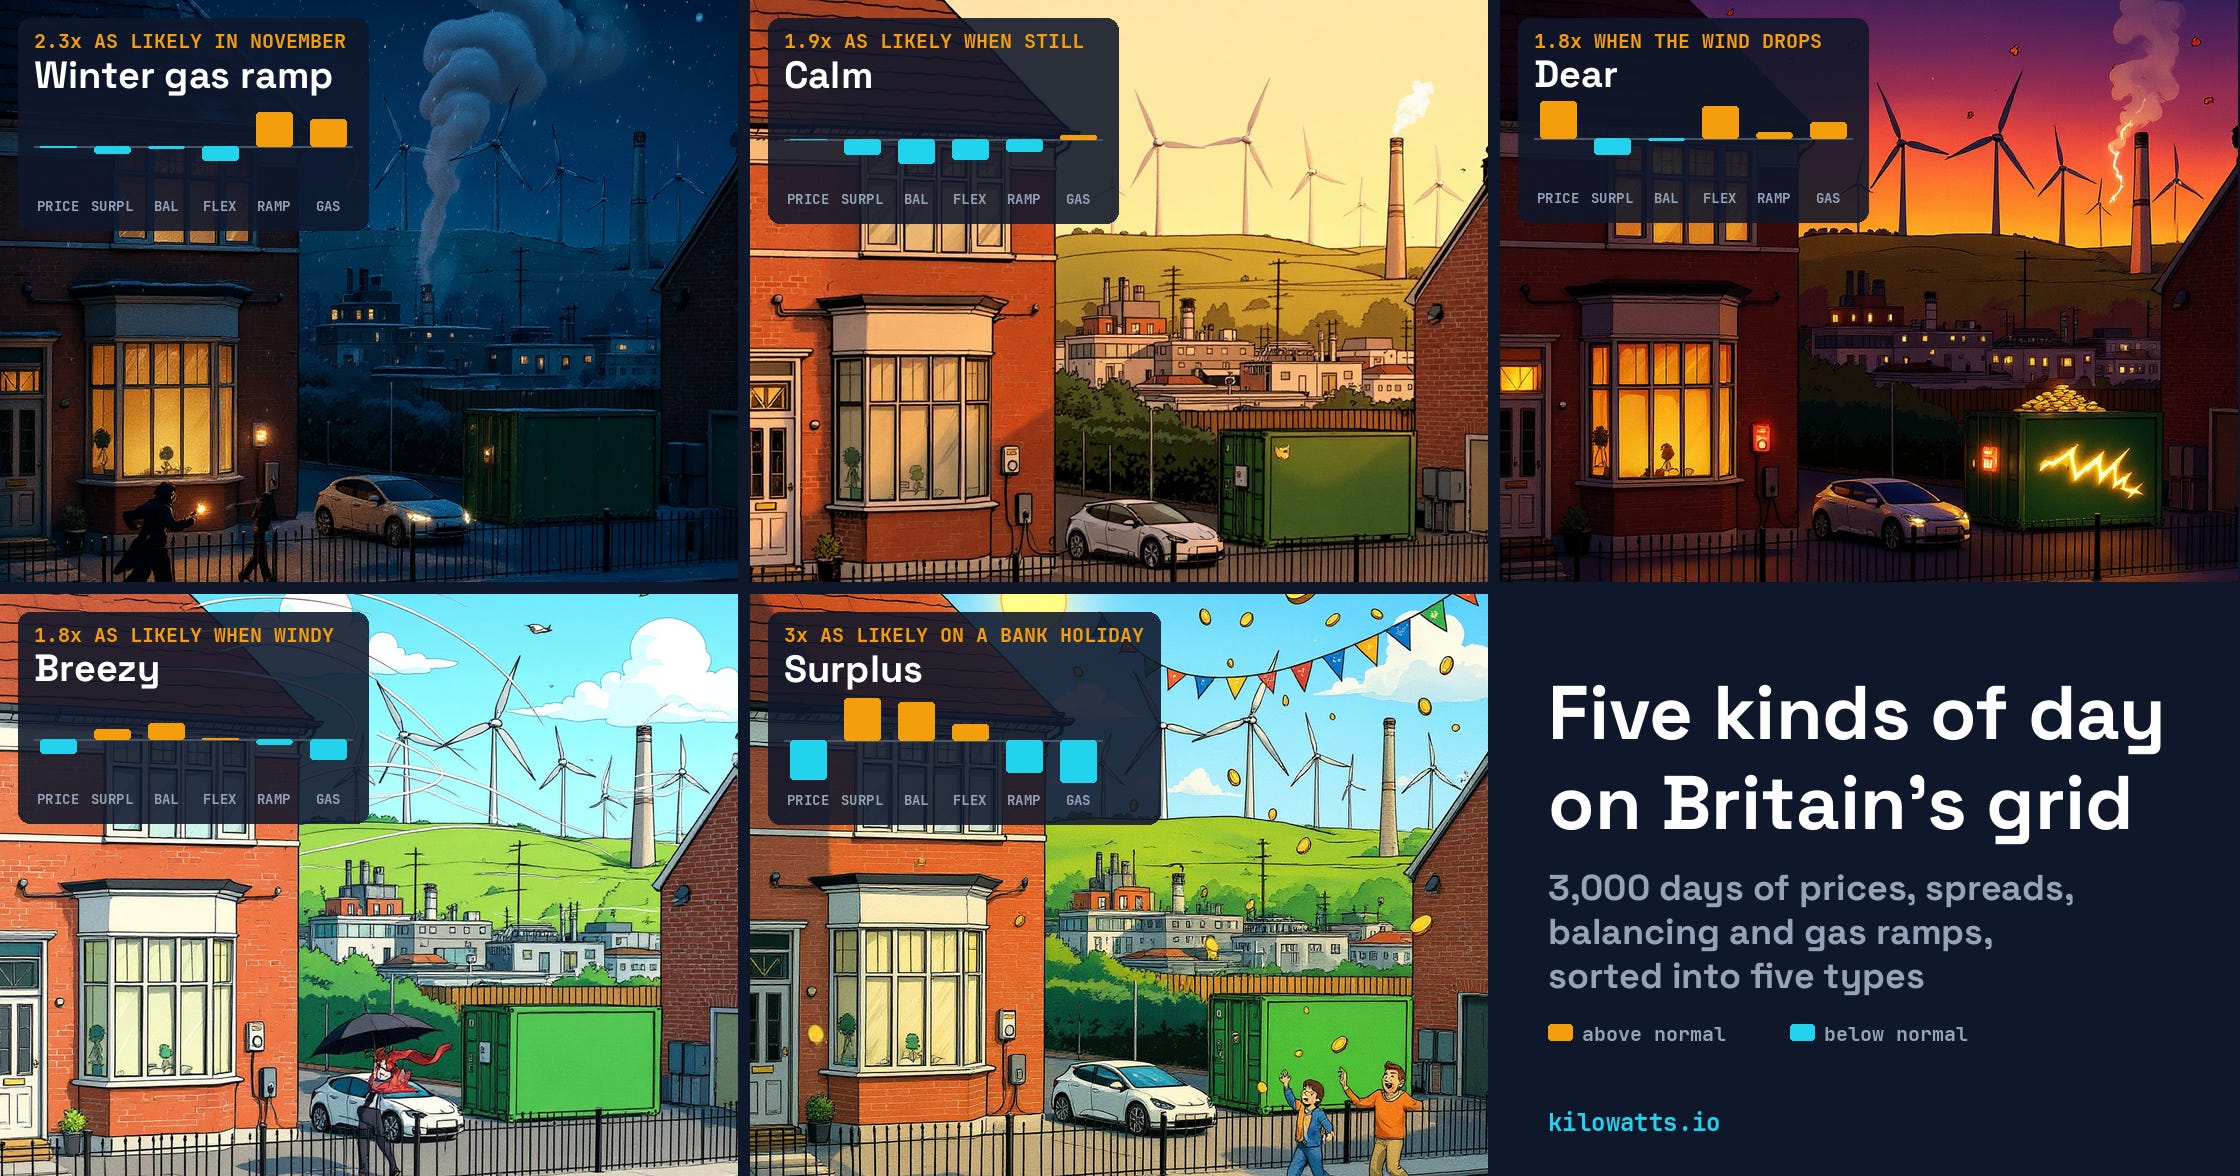
At 11:30 on Saturday 12 September, Britain's wind farms had 20.7 GW of wind available to them. Twenty-four hours later they were producing 0.7 GW. I wrote about that collapse last week: the record Sturzflaute. This week's question is what kind of days they were for the grid as a whole, not just for the wind.
The Friday before had the shape of a winter weekday, in September: the gas fleet ramping hard through the day. The Sunday of the collapse was calm. The balancing bill fell to £2.9m and nothing much moved, even though power averaged £195/MWh. By Tuesday, 11.8 GW of wind was back, and NESO spent £9.9m keeping it in the right places. Three quite different days in five, and the weather only explains part of why.
I scored every day since April 2017 on the things that make a day expensive or interesting for the grid:
what power costs
whether there is more of it than anyone wants
what it costs NESO to balance
how wide the spread is for a battery
how hard the gas fleet has to ramp
how much gas it burns
Sorted by those scores, the days fall into five recognisable stereotypes.
Meet the five stereotypes
Surplus: a bank holiday in a gale. Power costs half what a gas plant needs to run, prices go negative, and NESO pays wind farms to stop.
Breezy: an ordinary windy day, often a weekend. Cheap power, little gas, a big constraint bill.
Calm: a still, usually summery day on which very little happens. The cheapest days to balance and the flattest for a battery.
Winter gas ramp: a November-to-February weekday. The gas fleet swings hardest, and prices barely notice.
Dear: a working day when the wind falls away, most often in autumn. High prices, the widest spreads, the most gas.
Every day since April 2017 belongs to one of the five: together they cover the whole year, not just its extremes. They are stereotypes in the honest sense. Most days are a bit of one and a bit of another, and the lines between them are soft. But they are stable: fit them again on a random 80% of the days and every one reappears at least 93% of the time. About half of all days are clear examples of their type; most of the rest lean towards one but share traits with another, and one day in twenty sits closer to a different stereotype altogether. Surplus days are the most distinct, with 63% clear examples; Dear days the least, with 43%. And their mix has changed dramatically.