


Here’s the good news first, because there’s a lot of it.
In spring 2022, at the peak of the price shock that followed Russia’s invasion of Ukraine, I bought a heat pump with a £5,000 Boiler Upgrade Scheme grant. It went into a postwar prefab at the top of Princetown, one of the highest villages in England, on a moor that gets more weather than most of the country. Plenty of people would have told me that was the wrong house for a heat pump.
Four and a half winters later it has kept us warm at a lifetime efficiency of about 3.3: 32,000 kWh of heat for 9,800 kWh of electricity. This October the whole house, heat pump, hot water and two electric cars, cost about £40 in energy.
This summer I wrote about how I regret my heat pump lacks air conditioning. This is the winter sequel. It’s a happier one, though not entirely.
This autumn I found out that my heat pump has probably been running “wet” for years: letting liquid refrigerant into a compressor that’s meant to see only gas.
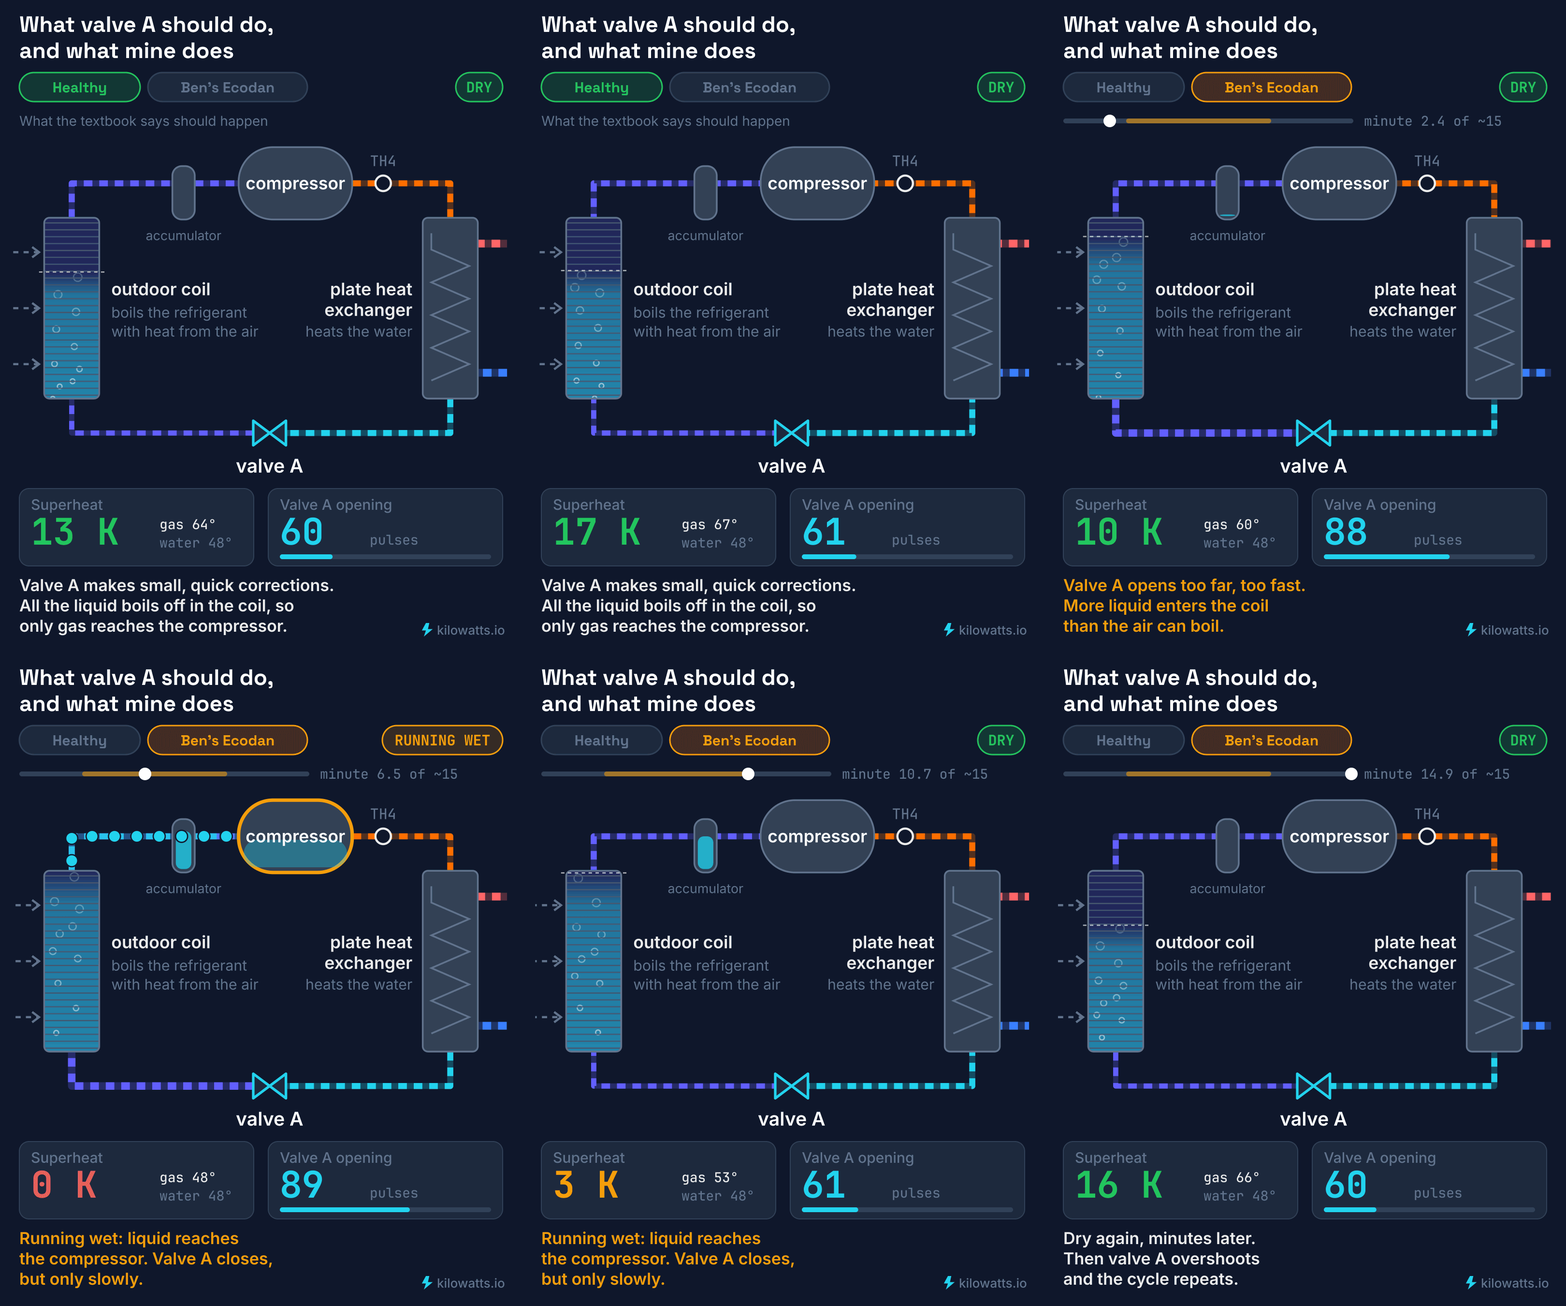
What should happen, then what mine does: a valve opens too far, and liquid floods the compressor.
No app showed it, no error code flagged it and no annual service would have caught it. And I didn’t find it on my own. I’m an economist; my education taught me far more about interest rates and trade balances than compressors and refrigerants. I found it thanks to a remarkable community of heat pump owners, engineers and tinkerers who share their data, tools and time for free.
So here are seven things I wish I’d known before I bought a heat pump, and who taught me each one. There’s a checklist at the end for anyone choosing one now.
1. It works, and you can prove it
Taught by: heatpumpmonitor.org
If you take one thing from this piece, make it this: heat pumps work, even in a draughty prefab on Dartmoor.
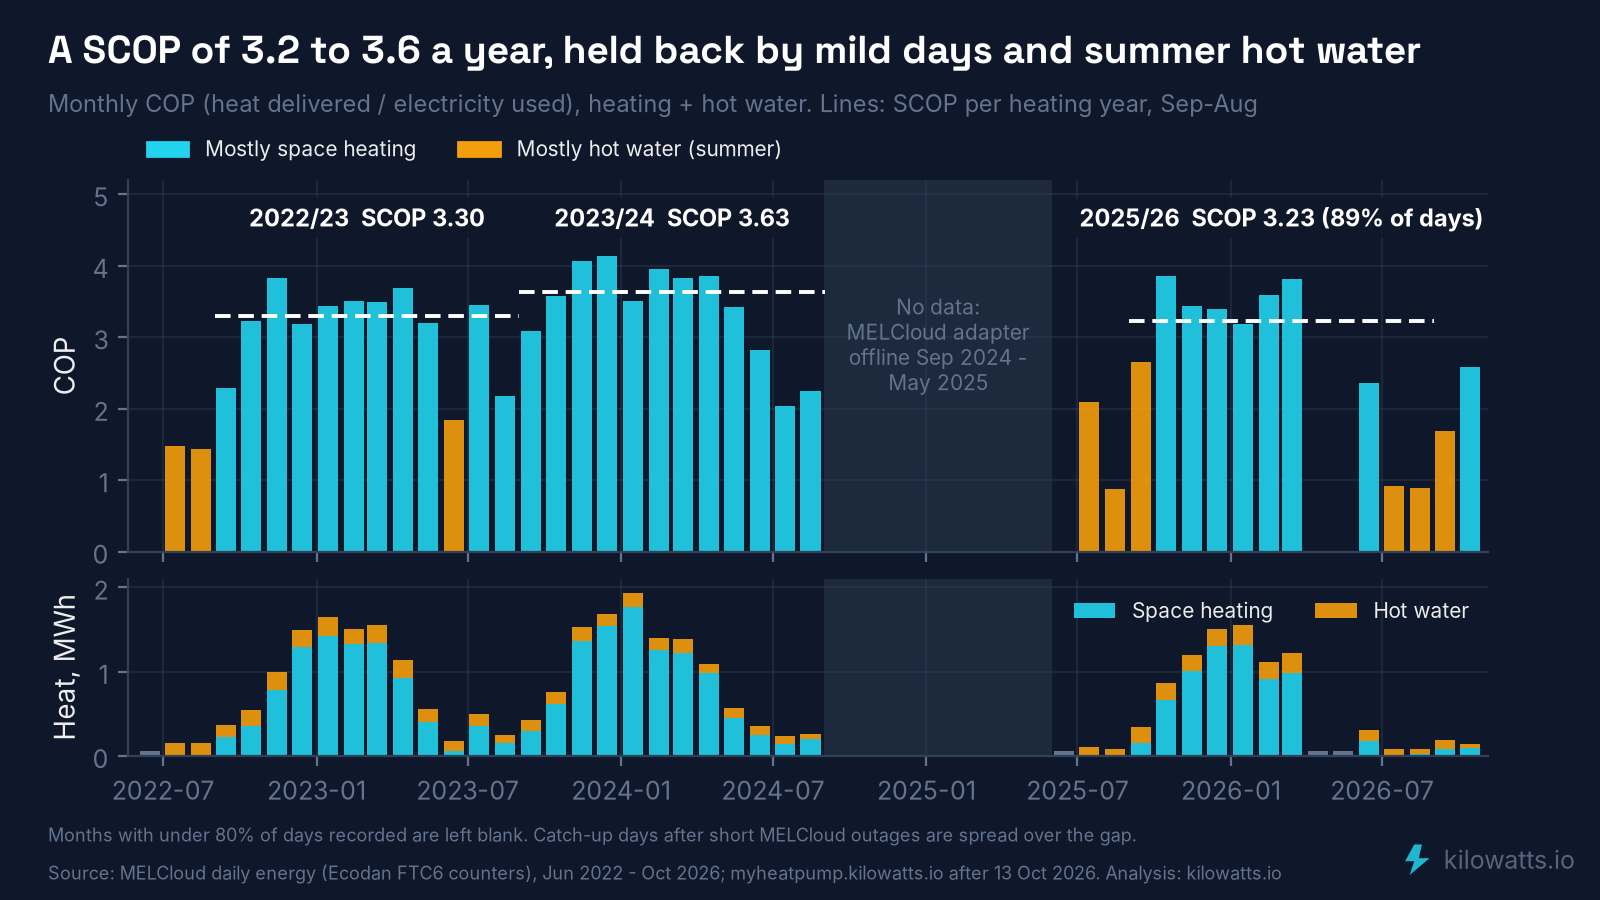
Each year mine has turned one unit of electricity into 3.2–3.6 units of heat. (2024/25 is missing because Mitsubishi’s cloud service dropped out.)
The way I know that, rather than just believing it, is heatpumpmonitor.org. It’s run by OpenEnergyMonitor, an open-source project founded by Trystan Lea and Glyn Hudson in North Wales, and it’s one of the best things to happen to heat pumps in Britain. Around 800 homes publish their real, metered performance for anyone to see, and there’s a free API that needs no key, which for someone like me is catnip. Mine is system 529. I’ve leaned on it before, in Heatpump Mythbusting, Heat pumps age like Bordeaux and I put 519 British heat pumps into the Balancing Mechanism.
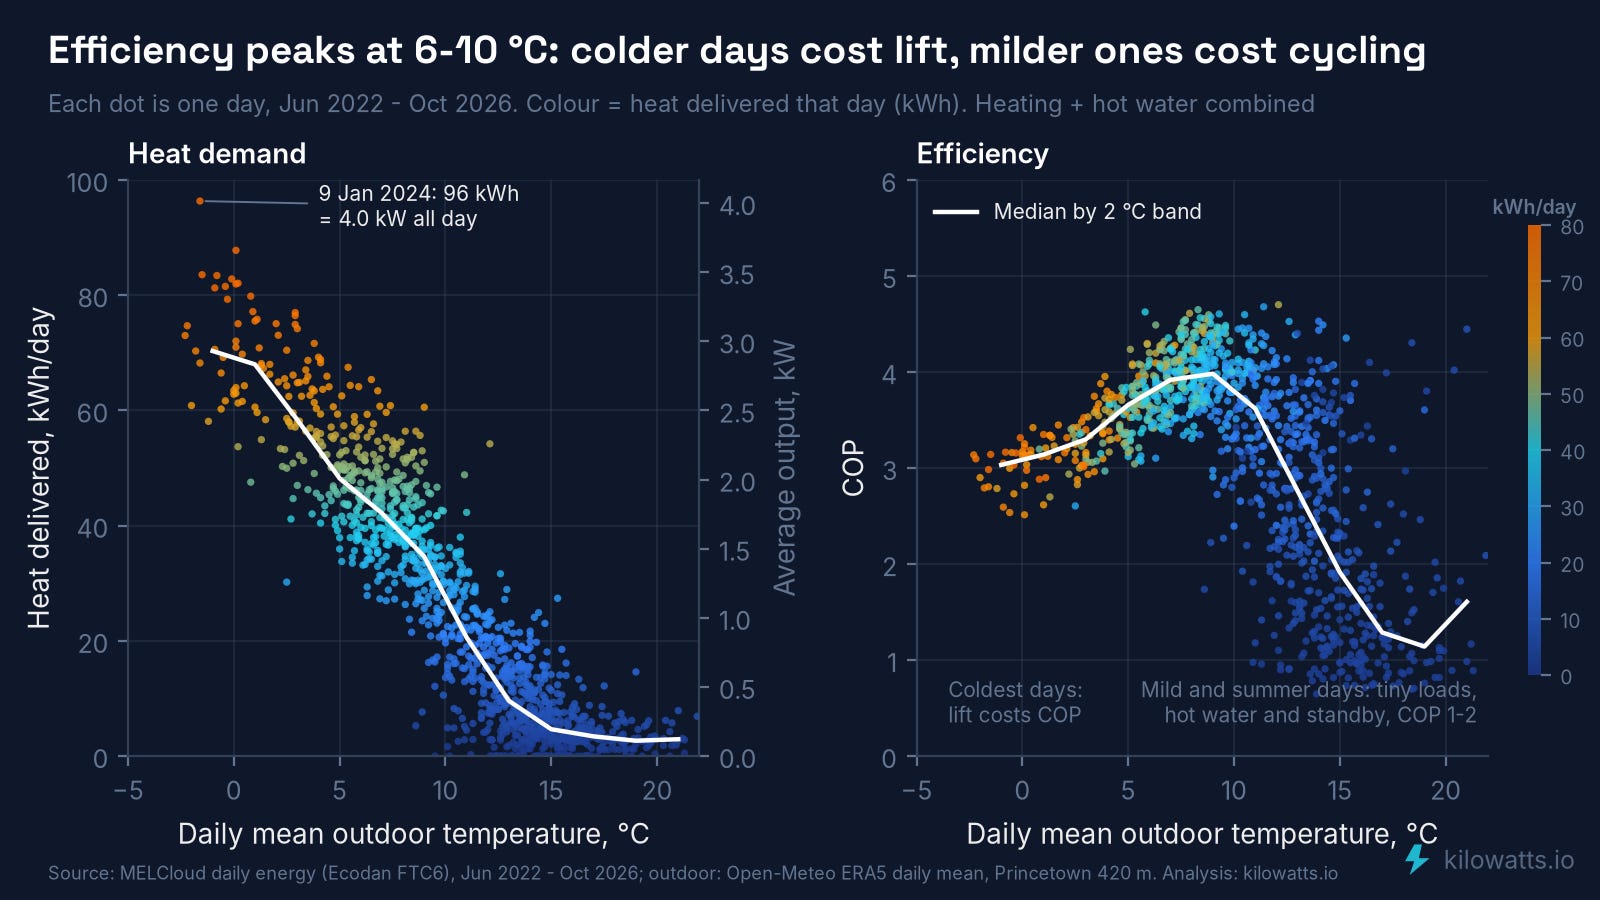
Left: how much heat the house needed each day, in kWh and as an average kW. Right: how efficiently it was made.
The pattern is what you’d expect: the colder it gets, the more heat the house needs and the harder the heat pump works for each unit. It’s at its best on 6–10 °C days, at a COP of about 4, and drops to about 3 in a frost. What surprised me was the other end. Above about 12 °C, when the house barely needs heating, efficiency collapses. Which brings me to lesson two.
2. Bigger isn’t safer
Taught by: heatpumpmonitor.org’s data, and a few humbling charts
The survey for my house suggested a smaller unit than the 6 kW one I ended up with. Princetown gets properly cold, the installer suggested going bigger, and “better safe than sorry” felt sensible. I don’t blame the installer: plenty of professionals would have looked at a postwar prefab and assumed it needed all the help it could get. I went in with my eyes open.
Look at the right-hand scale on that last chart. Even the coldest day in four years, 9 January 2024, averaged only about 4 kW. Most heating days needed between half a kilowatt and two. A gas boiler simply turns down to match. A heat pump can only turn down so far, and mine can’t turn down very far at all.
heatpumpmonitor.org keeps owner-run tests of how low each model will go. The 6 kW R32 Ecodan bottoms out at about 3 kW, half its rating; only 6 of the 45 models tested do worse, and several 6 kW units from Nibe, Daikin and Grant get down to 1.1–1.5 kW. In practice the lowest mine actually runs is about 2.2 kW. Here’s how that compares with what the house needs:
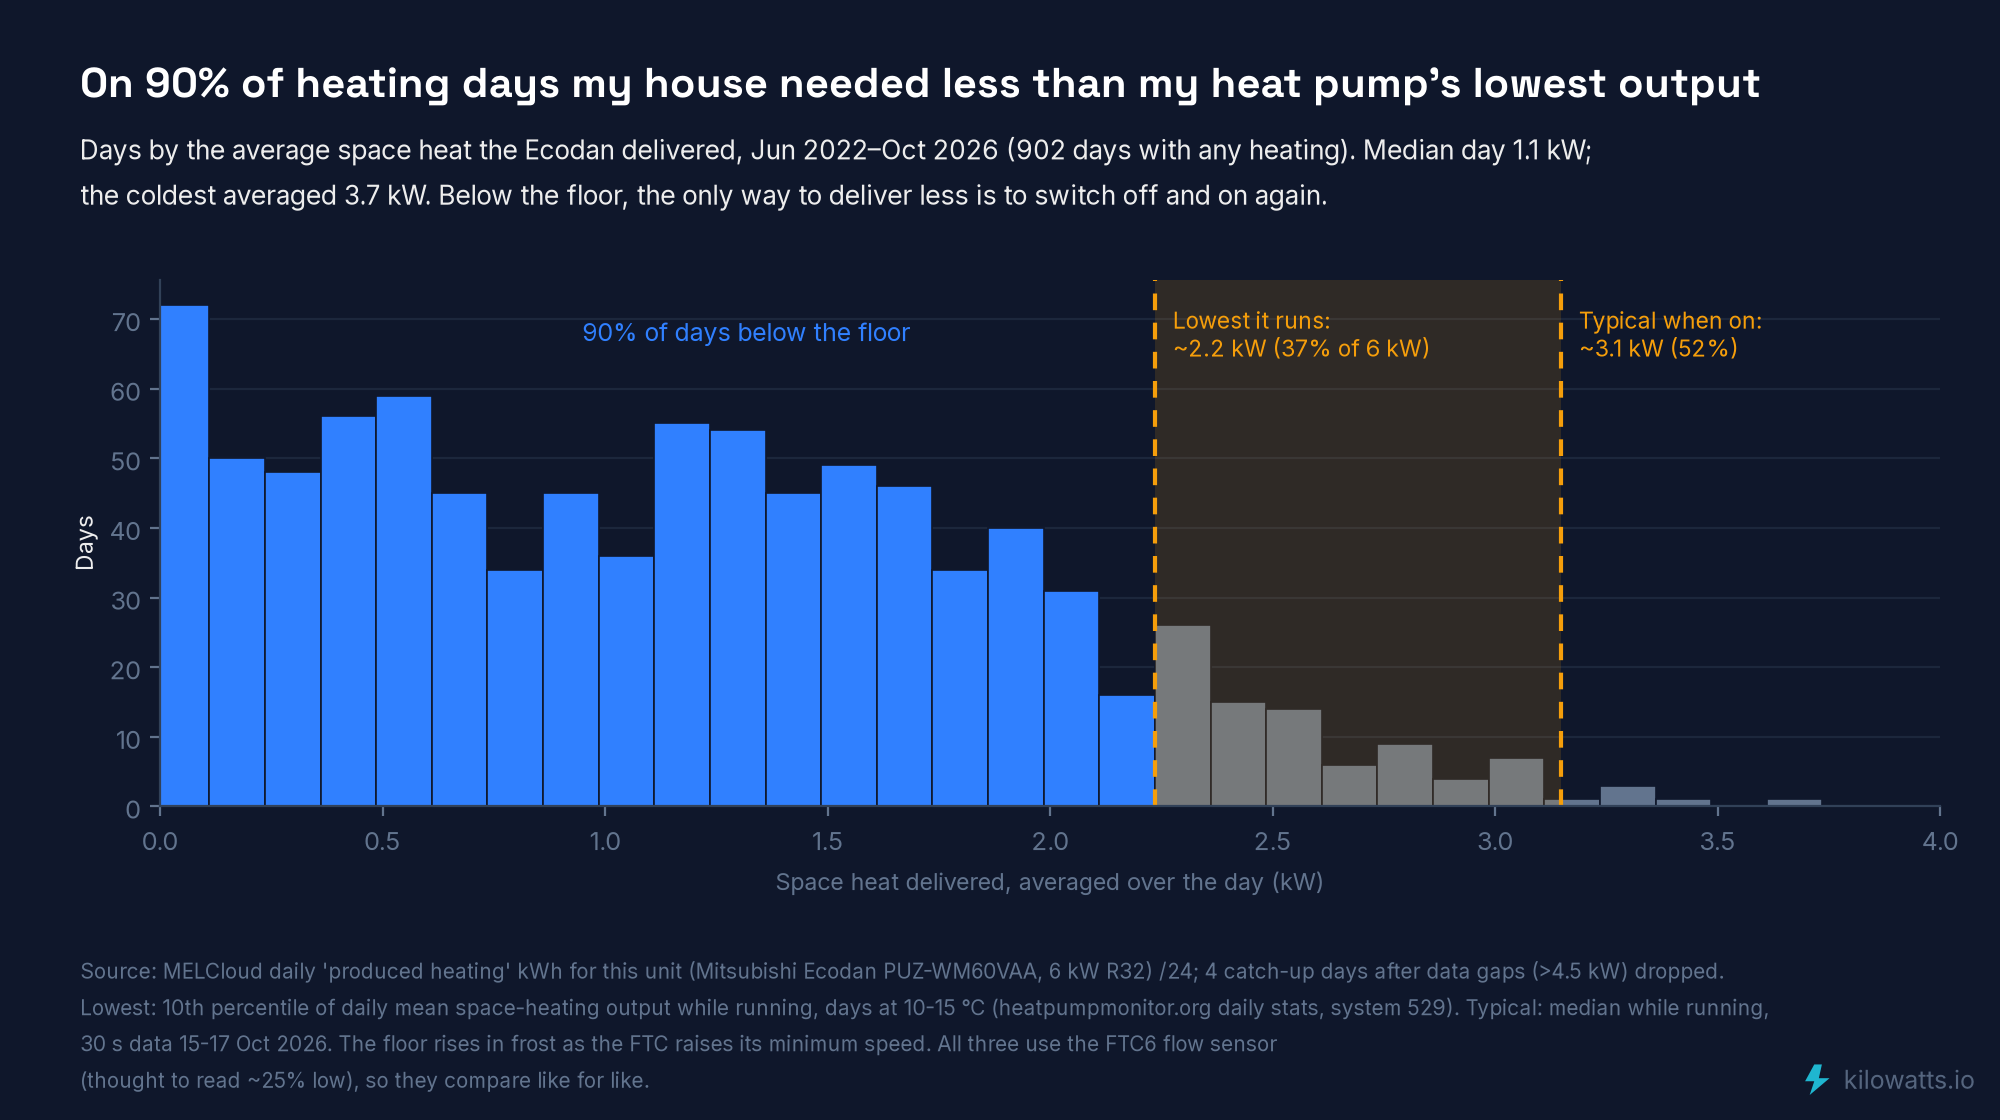
On 90% of heating days since 2022, the house needed less heat than my heat pump’s lowest output.
Anyone who has worked on power markets will recognise this. A gas power station has a “minimum stable generation” level, about 55% of its maximum for the median British unit, and below that it has to switch off rather than turn down. My heat pump behaves the same way. On a mild day the house wants a trickle, the heat pump can only deliver a gush, so it runs, overshoots, stops and starts again.
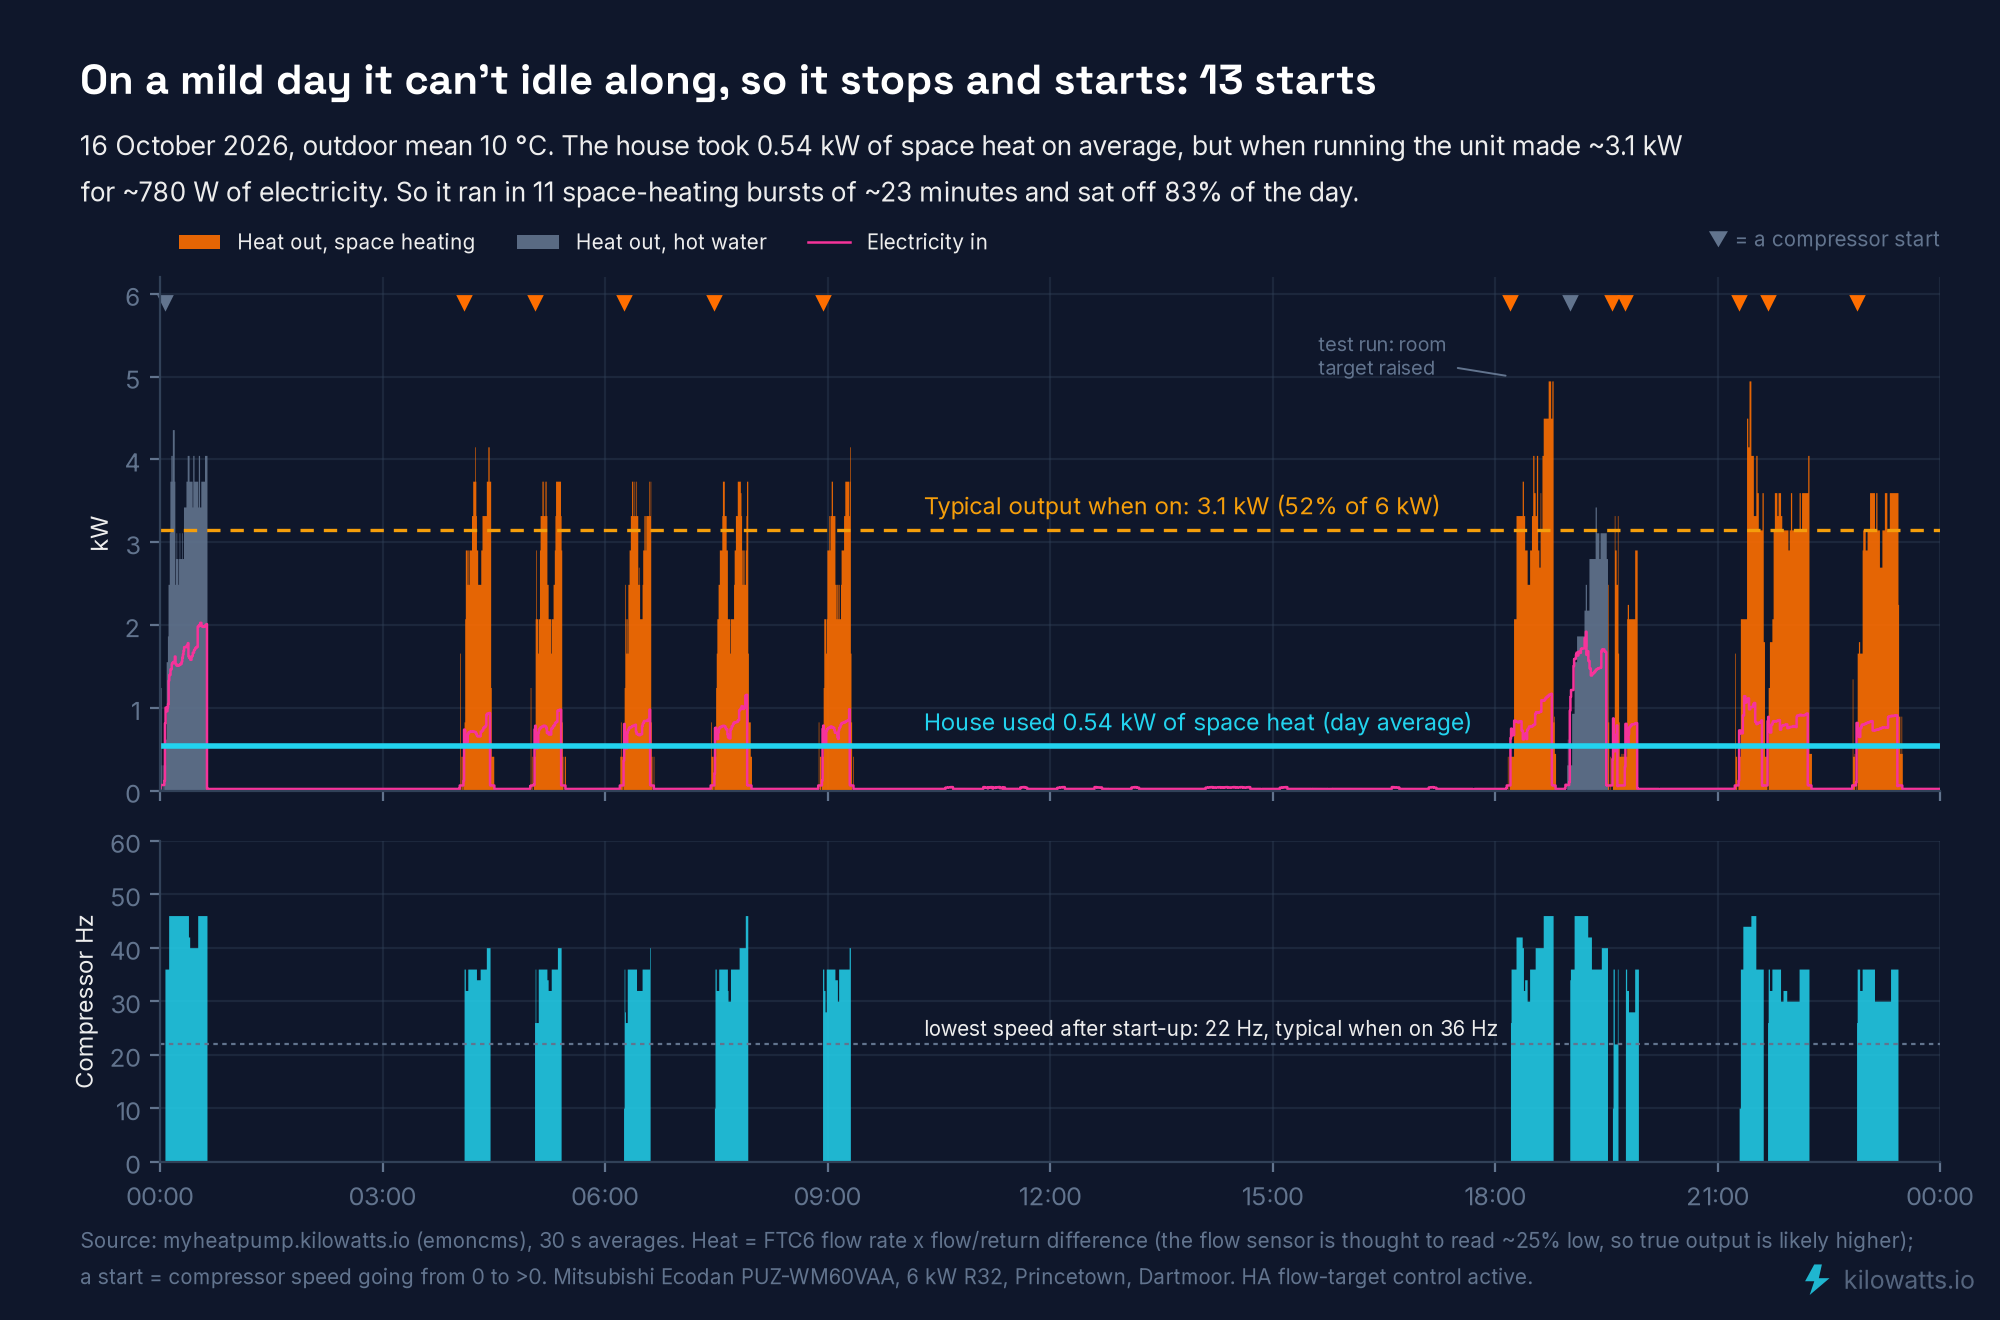
16 October, a 10 °C day: the house needed about half a kilowatt on average. The heat pump delivered it in 13 bursts and sat idle 83% of the day.
On mild days mine starts about 16 times, against about 8 for a typical monitored system. My dashboard now flags these spells automatically; in the past week it found eight, all on 11–15 °C days. Every start costs a little efficiency and a little wear.
What I wish I’d asked: not “what’s the maximum output?” but “what’s the minimum, and how does it compare with what my house needs on a mild day?”
3. The brand matters, and you can check it
Taught by: the OpenEnergyMonitor team’s open data
When I bought mine, Mitsubishi billed itself as Britain’s biggest heat pump maker, and Ecodans have been built in Livingston, Scotland, since 2009. Both counted for me.
Since then I’ve noticed that when installers and enthusiasts recommend a brand, it’s more often Vaillant. There are no public market-share figures by brand, but heatpumpmonitor.org offers a clue.
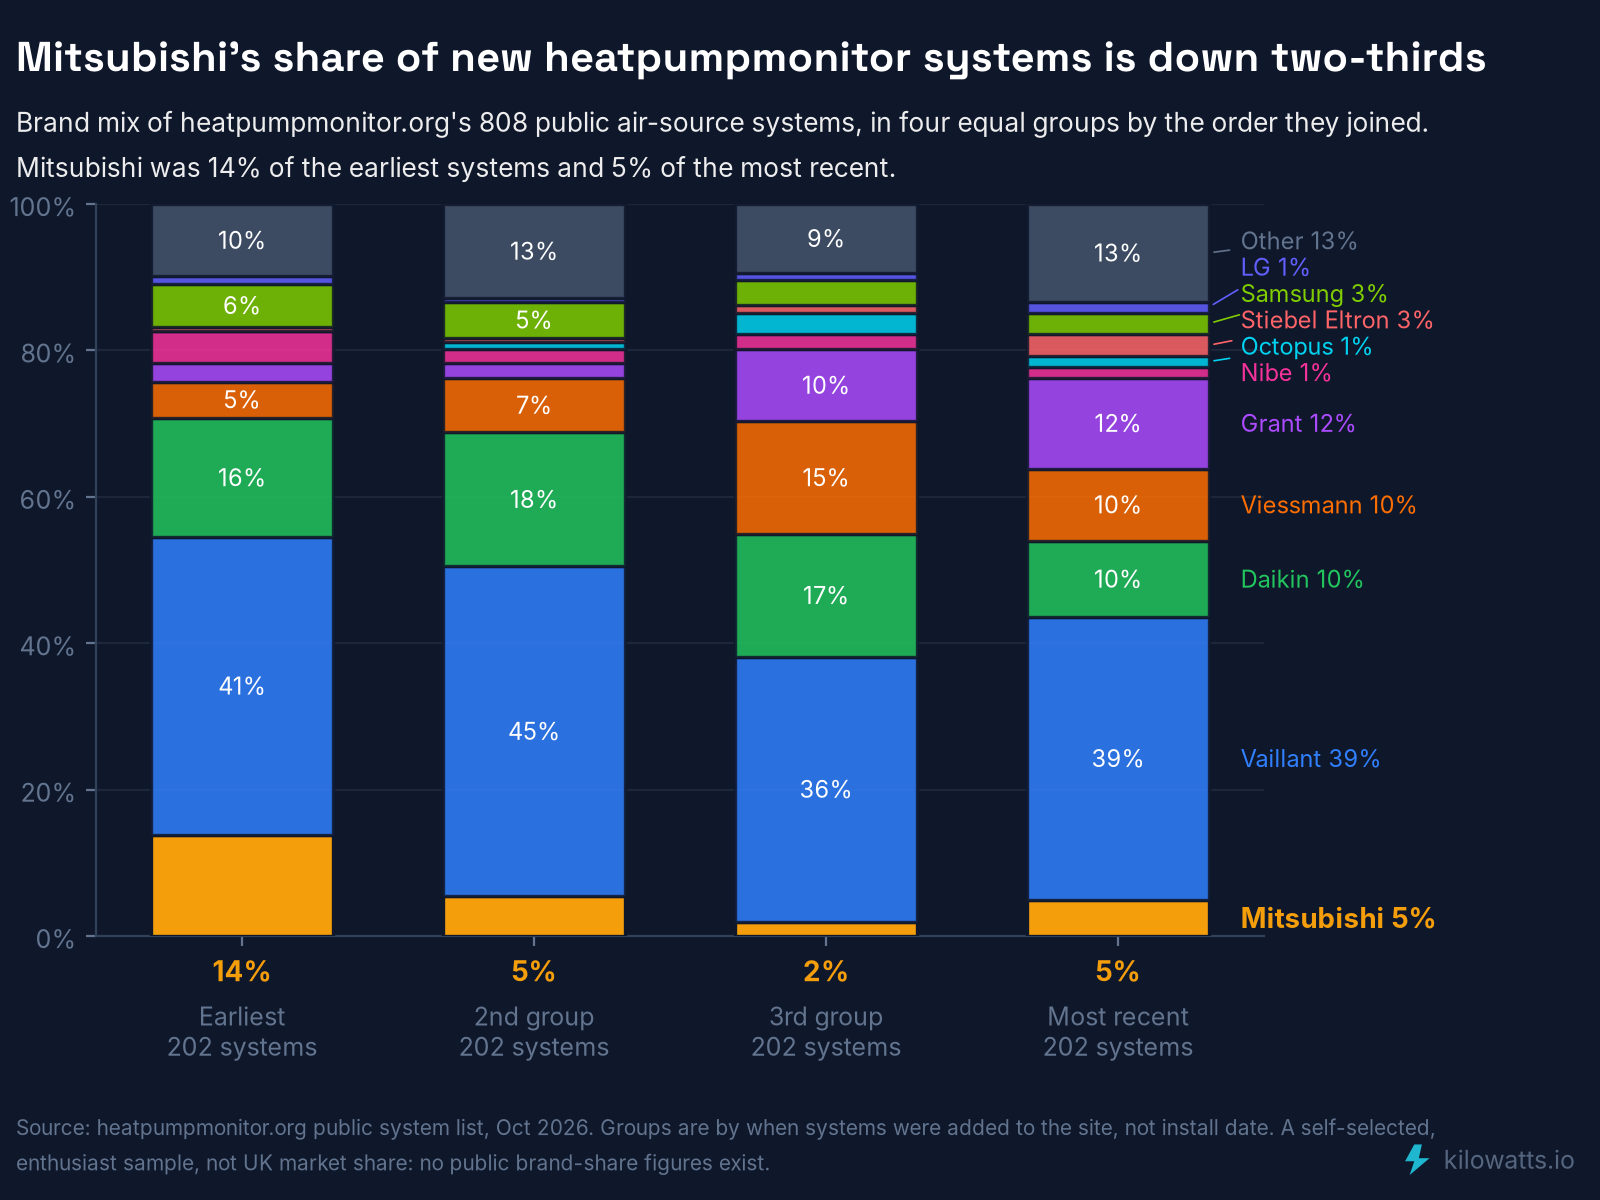
One in seven of the first 200 or so systems published there was a Mitsubishi. Among recent arrivals it’s one in twenty.
That’s a self-selected group of well-informed enthusiasts, so it isn’t market share, but it’s an important signal. Is the preference fair? Across the 250 systems most like mine (air source, radiators, a full year of good data), it’s closer than I expected: Vaillant and Viessmann lead at a median COP of about 4.0, Ecodans sit mid-table at 3.9, ahead of Daikin and Samsung, and the spread within each brand is bigger than the gap between them.
So I compared my own unit with everyone else’s over the same weeks this autumn.
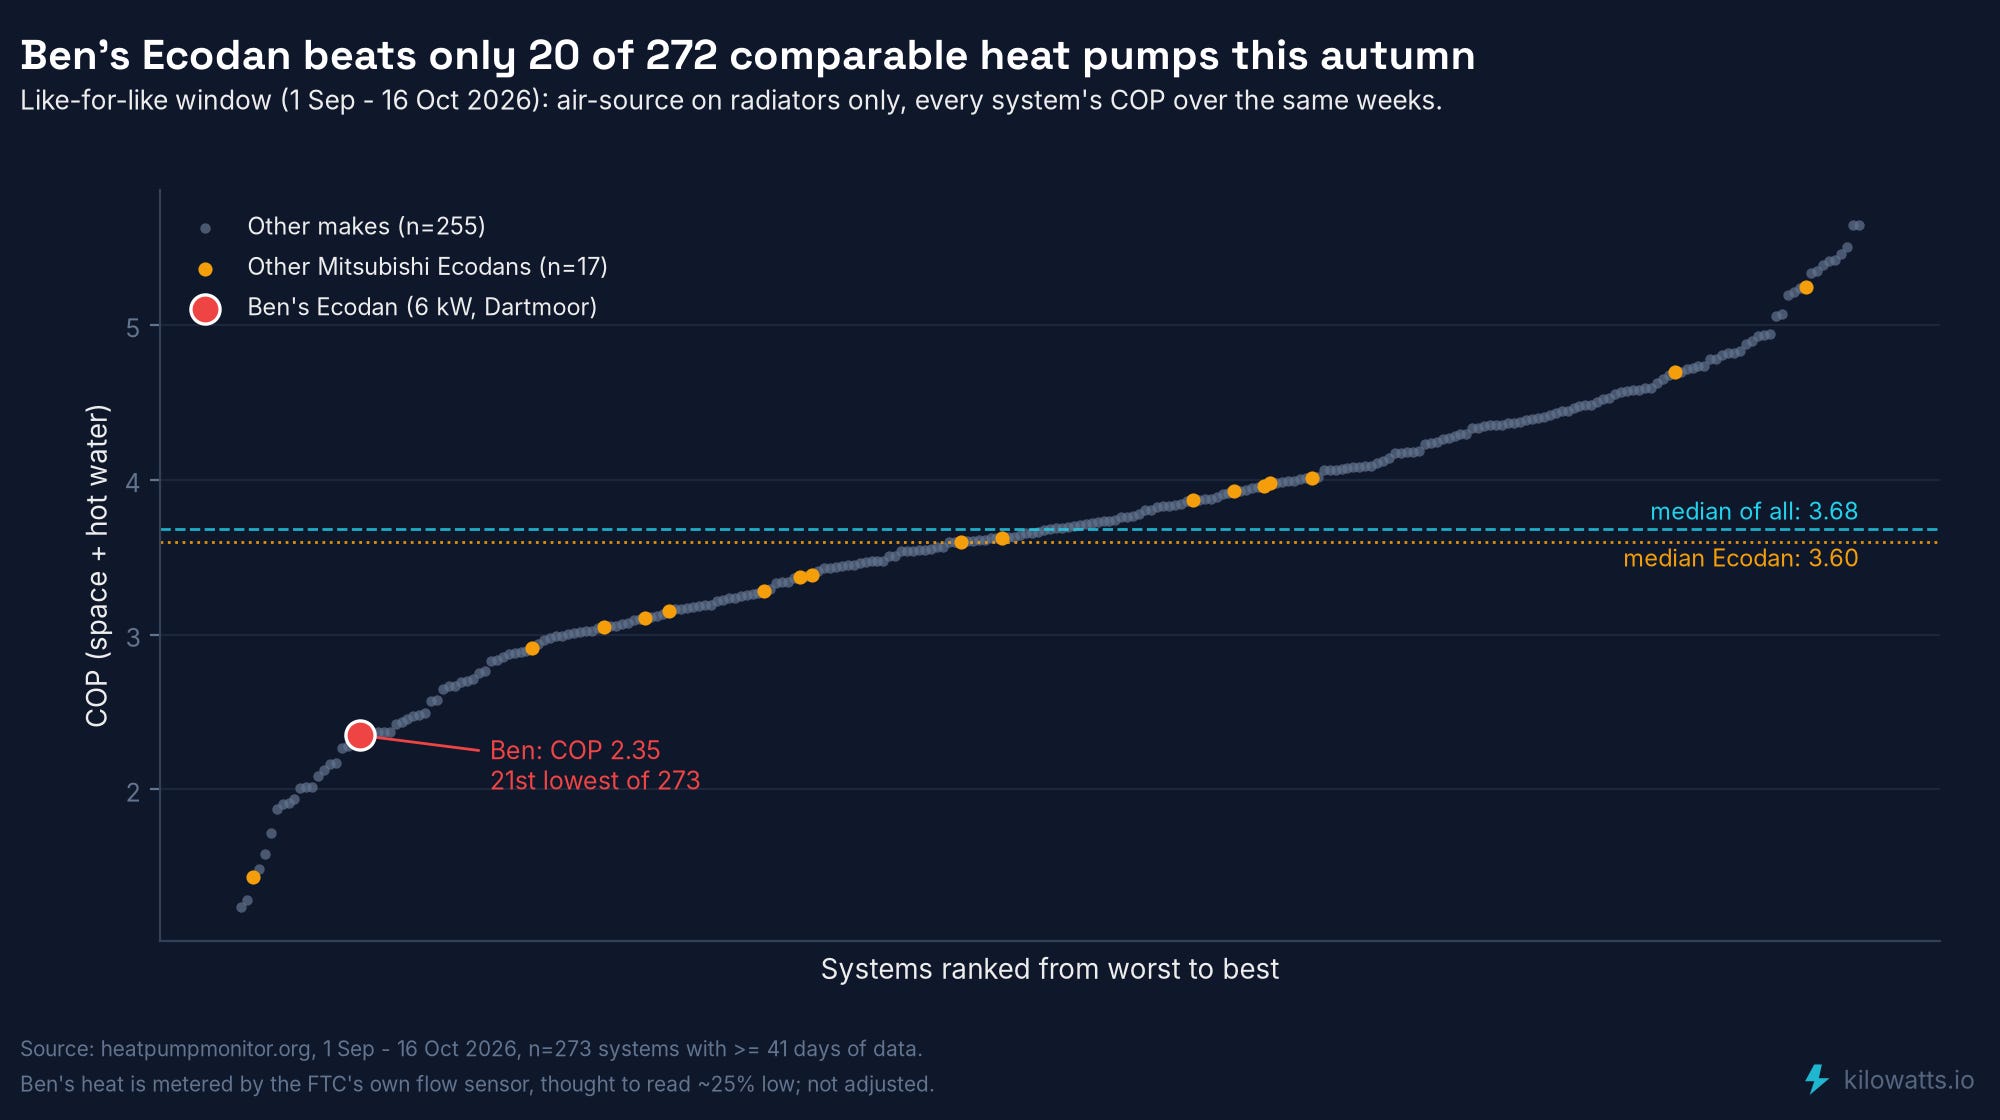
Of 273 comparable systems, mine came 21st from the bottom. Only one of the 17 other Ecodans did worse.
That was humbling: a COP of 2.35 against a median of 3.69, starting and stopping about four times as often as a typical system. (Perhaps a quarter of that gap comes from my flow sensor reading low; even corrected, it stays well below the median.) So it isn’t the brand, and it isn’t only Dartmoor’s weather or an oversized unit. Something about this heat pump was off.
The clearest test is to split the weather. Across nearly 300 radiator systems on heatpumpmonitor.org, here’s how each brand does on cold days and on mild ones, with mine as the star:
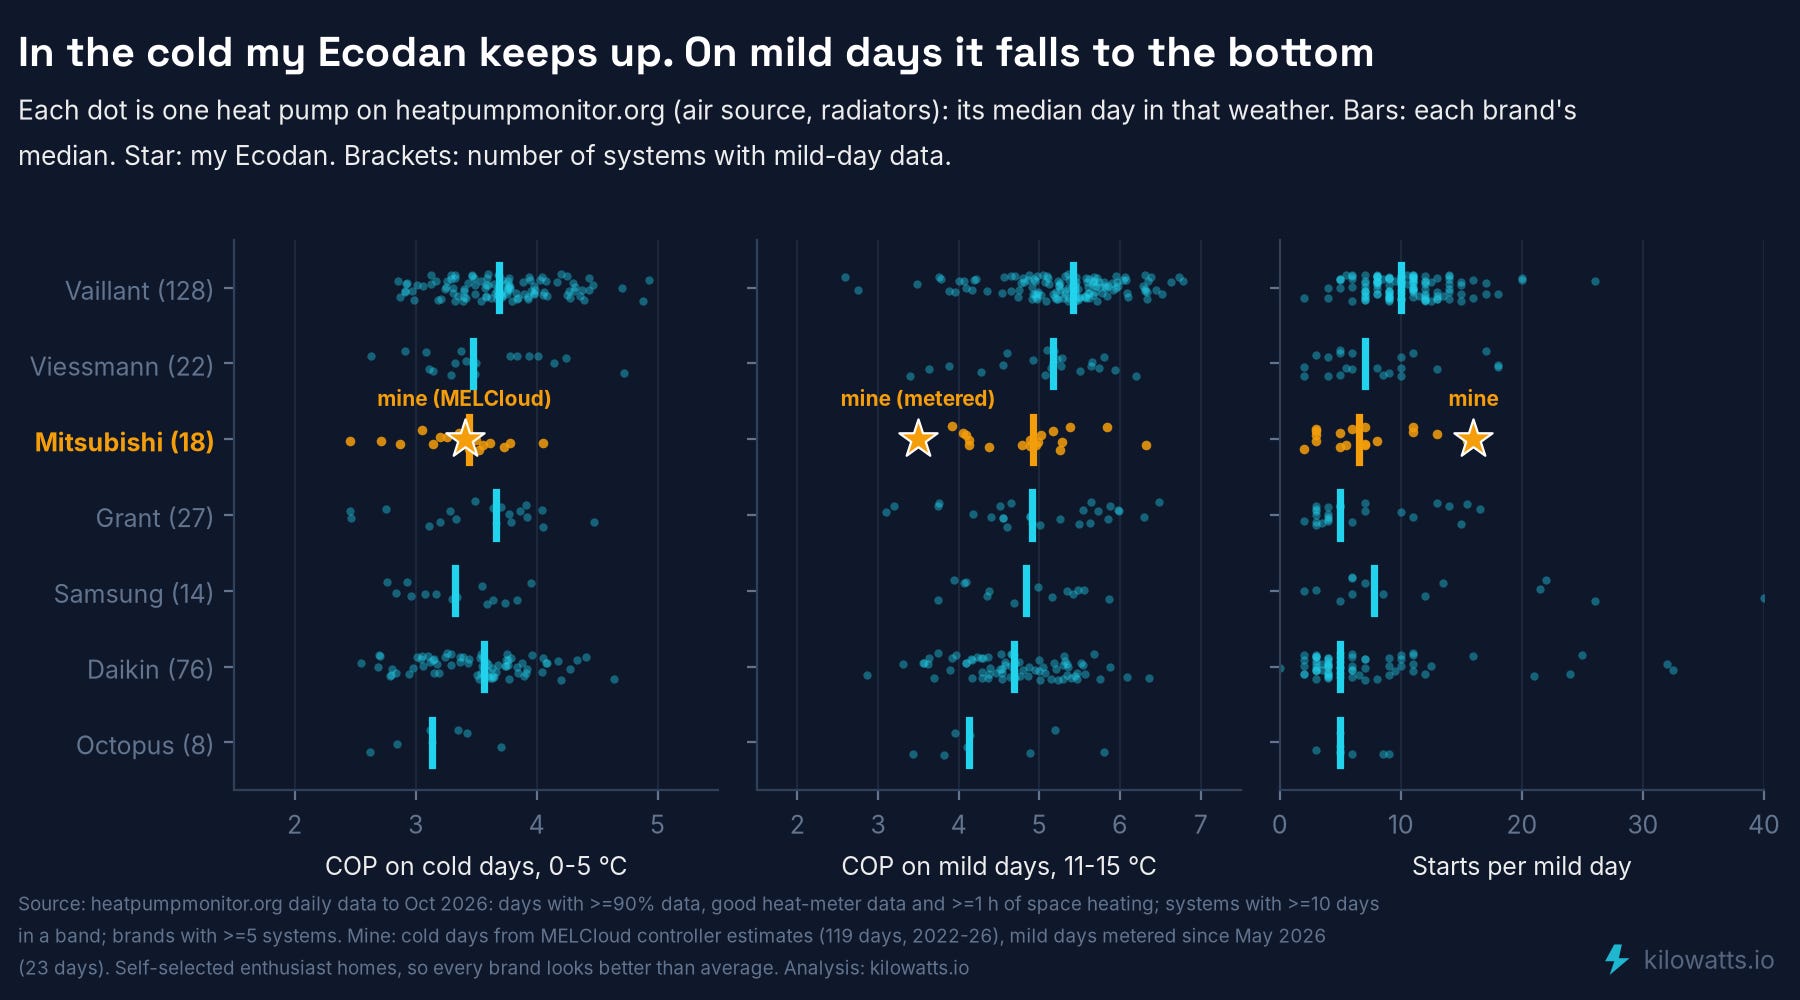
Each dot is one heat pump’s typical day in that weather. My cold days come from four winters of Mitsubishi’s own figures; my mild days are metered.
On cold days, 0–5 °C, mine is bang on the Ecodan median, with a COP of about 3.4, and on cold days the brands are all much closer together. When the heat pump is working hard, there’s nothing wrong with it.
Mild days are different. The 18 other Ecodans hold their own, at a median COP of about 4.9, alongside Grant and Samsung and not far behind Vaillant. Mine manages 3.5, the lowest of any Ecodan, and only 9 of the 293 systems do worse. It also starts about 16 times on a mild day, against 6 or 7 for a typical Ecodan.
What does that add up to? My Home Assistant has now learned enough about the house, how fast it loses heat and how warm the radiators need to run, to estimate what this heat pump should use in any weather, at the efficiency mine already manages on cold days. Over the past year it used about 2,265 kWh against roughly 1,850 achievable: 22% more. Between 4 and 8 °C it’s within 10%, and on the few days below 2 °C it used about 40% more. But nearly two-thirds of the waste comes outside December to February, on mild days and through the summer, when the heat pump is mostly heating water and stopping and starting. Above 12 °C it uses between one and a half and two and a half times what it should.
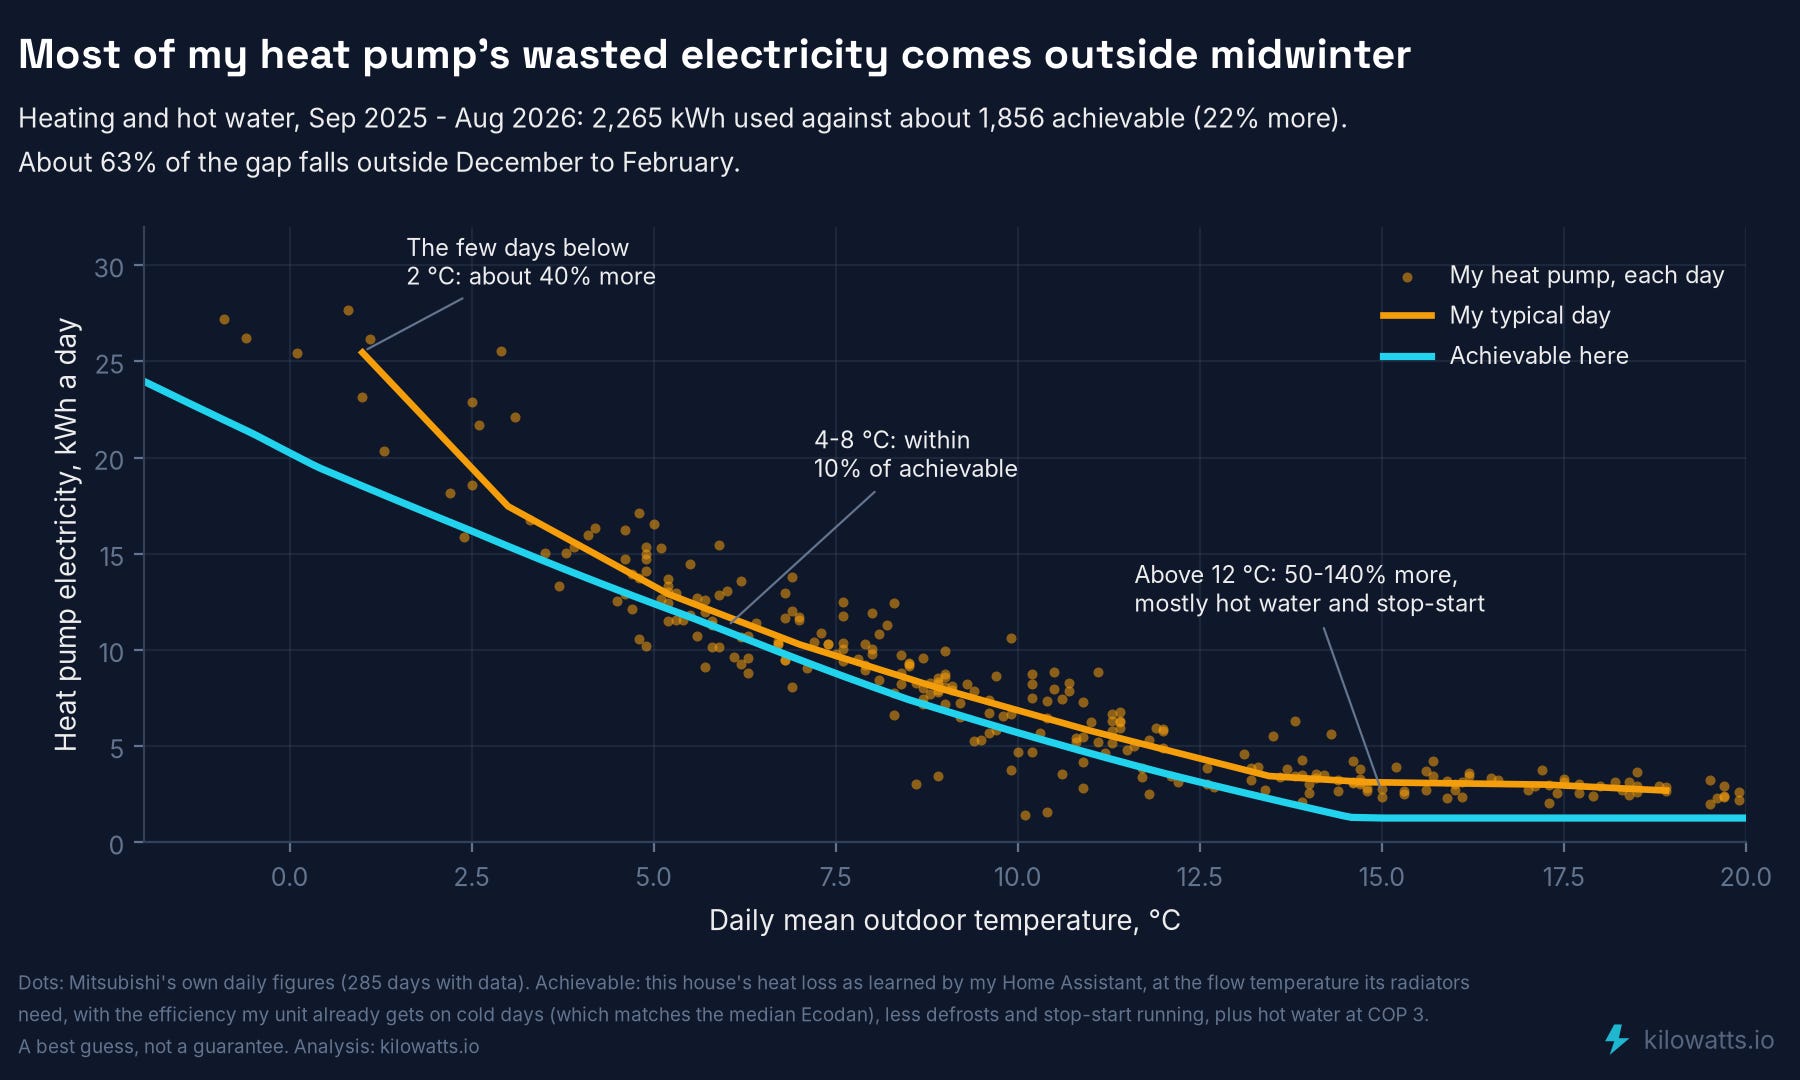
Each dot is one day. The blue line is my best guess at what this house should need: an estimate, not a guarantee.
Starting often isn’t the whole story, though. Vaillants start more often than any other brand here, about 10 times a day, and are still the most efficient. What matters is what happens each time mine starts, and that’s lesson 5.
Around then, at an industry conference, I nearly spat out my coffee when a senior figure from an energy company told me how far he’d had to go to get a Mitsubishi heat pump removed from his home because it performed so badly. I won’t say more, but what stuck with me was how hard he’d had to push before anyone accepted there was a problem.
4. Get the data from day one
Taught by: Phil Thomson (F1p) and the emoncms community
Mitsubishi’s MELCloud app shows a few temperatures and how much electricity you’ve used, and not much else. Since January 2022 it has had ten updates on the App Store; eight of them say only “Minor improvements and updates”. Owners have noticed. It’s rated 1.7 stars across Apple and Google, against 4.3–4.5 for the apps from Vaillant, Daikin, Viessmann and Panasonic. Mitsubishi’s newer replacement, MELCloud Home, does no better at 1.6, and only NIBE’s app scores lower. “The heat pump is fine, this app is not,” as one 2024 reviewer put it.
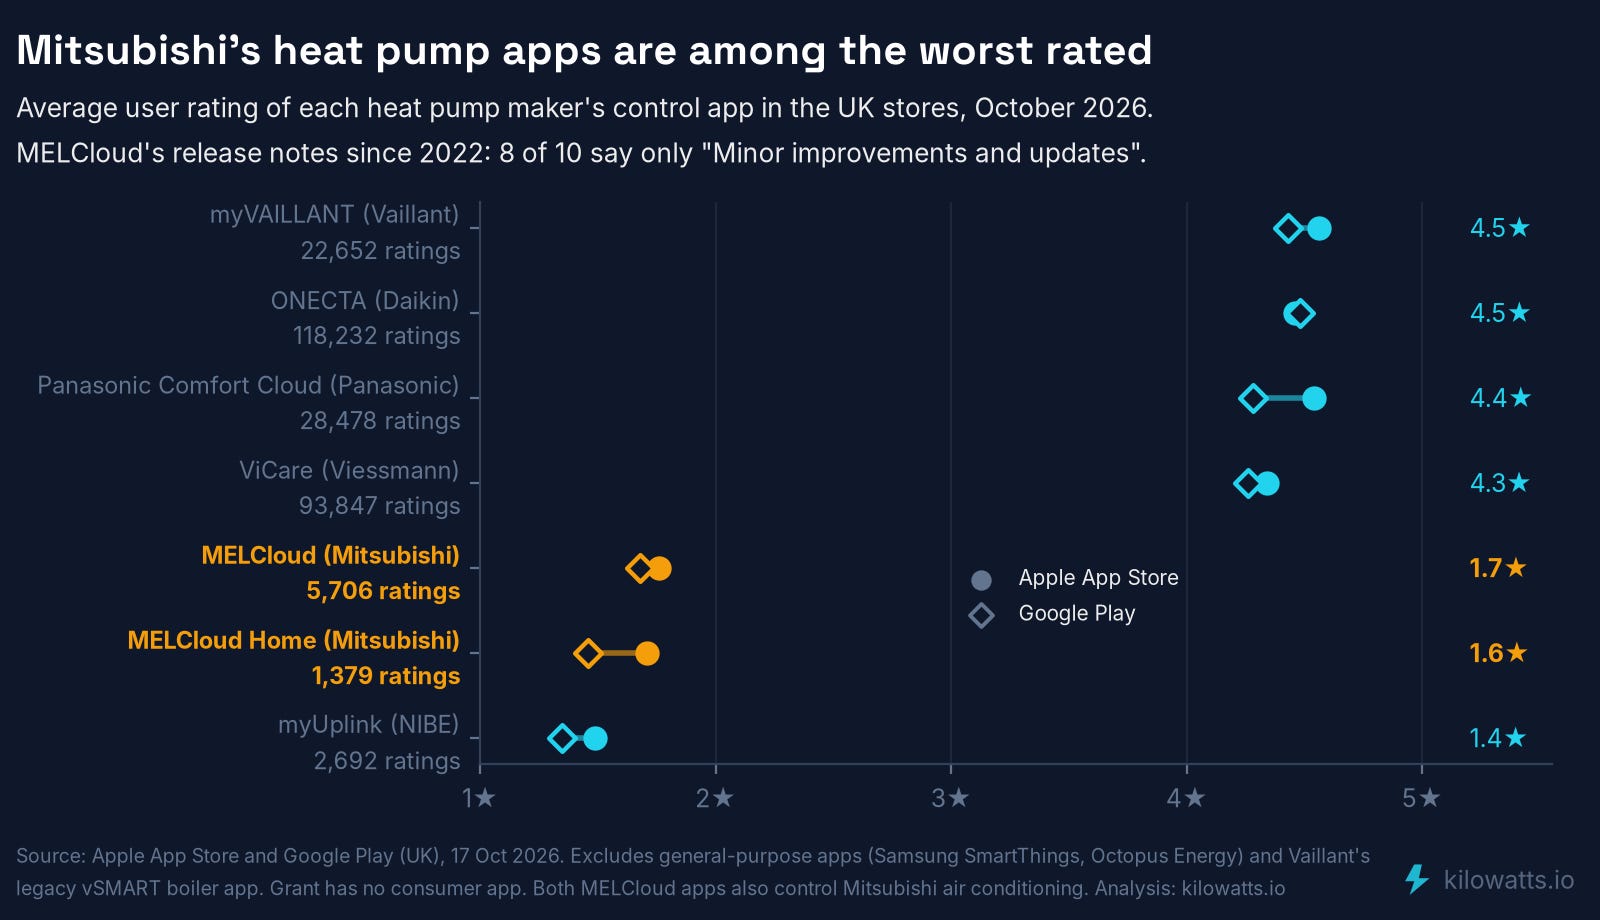
UK store ratings for each heat pump maker’s control app, October 2026.
You don’t have to live with the app, though. I run my heating through Home Assistant, which is free but takes some tinkering. If that’s not your idea of fun, Havenwise offers a much nicer app that works with Ecodans through Mitsubishi’s own cloud, so you don’t need any extra hardware. It can only see and change what Mitsubishi’s cloud lets it, though, so for the readings inside the refrigerant circuit you still need a bridge.
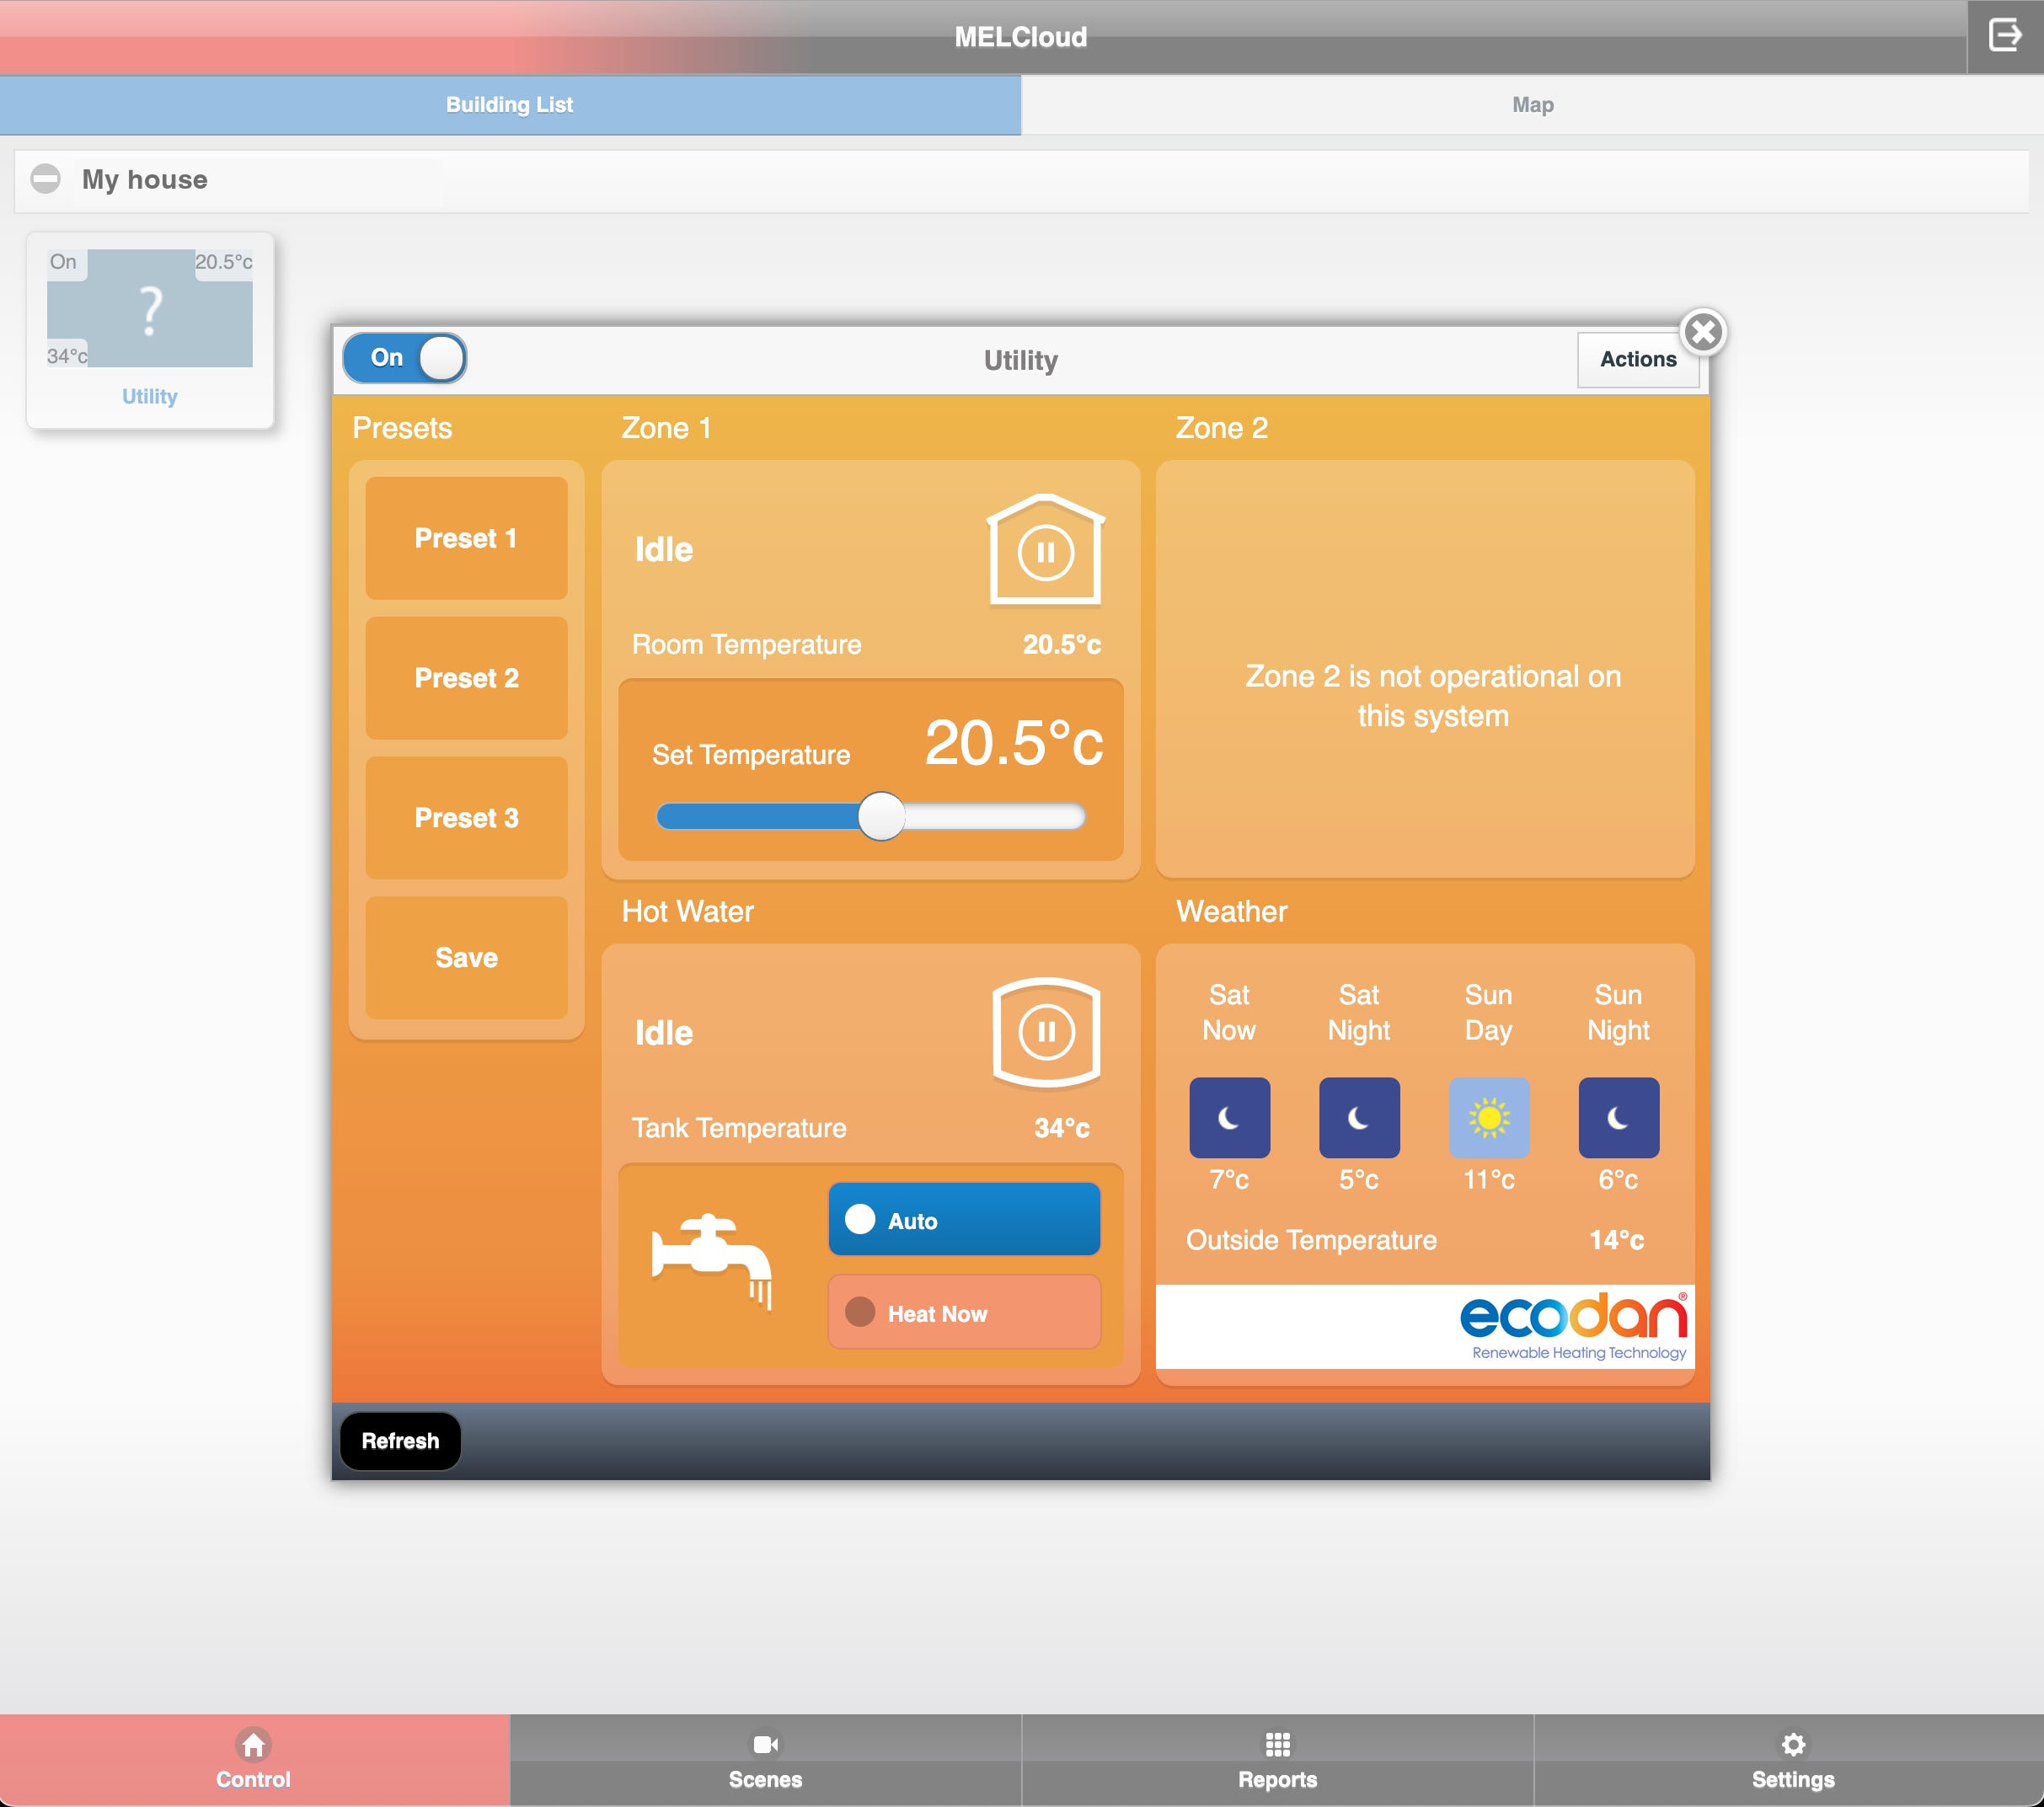
Mitsubishi’s MELCloud web app at 8pm on 17 October. It says 14 °C outside; the heat pump’s own sensor read 6–7 °C, and had last been at 14 °C four hours earlier. The building picture is a question mark.
Then I found a little Wi-Fi adapter made by Phil Thomson, known on the forums as F1p. I’ll call it the bridge. It plugs into a service port (CN105) on the heat pump’s controller and works a bit like an OBD reader for a car: every 30 seconds it reads what the controller knows, including readings from inside the refrigerant circuit that owners never normally see.
It costs £34.99 on eBay at the time of writing. That’s a rounding error on the cost of an installation, and about a ninth of what Mitsubishi charges for an engineer’s visit. The extra data it captures, compared with the manufacturer’s app, is invaluable. If I were having a Mitsubishi installed today, I’d ask for one on day one. (If the listing ever disappears, the design and software are open source.)
Because heatpumpmonitor.org runs on emoncms, which will store any time series you give it, I started logging everything the bridge could read: refrigerant temperatures, both expansion valves, fan and compressor speed, superheat and subcooling. All of it is now on an open, live dashboard at myheatpump.kilowatts.io.
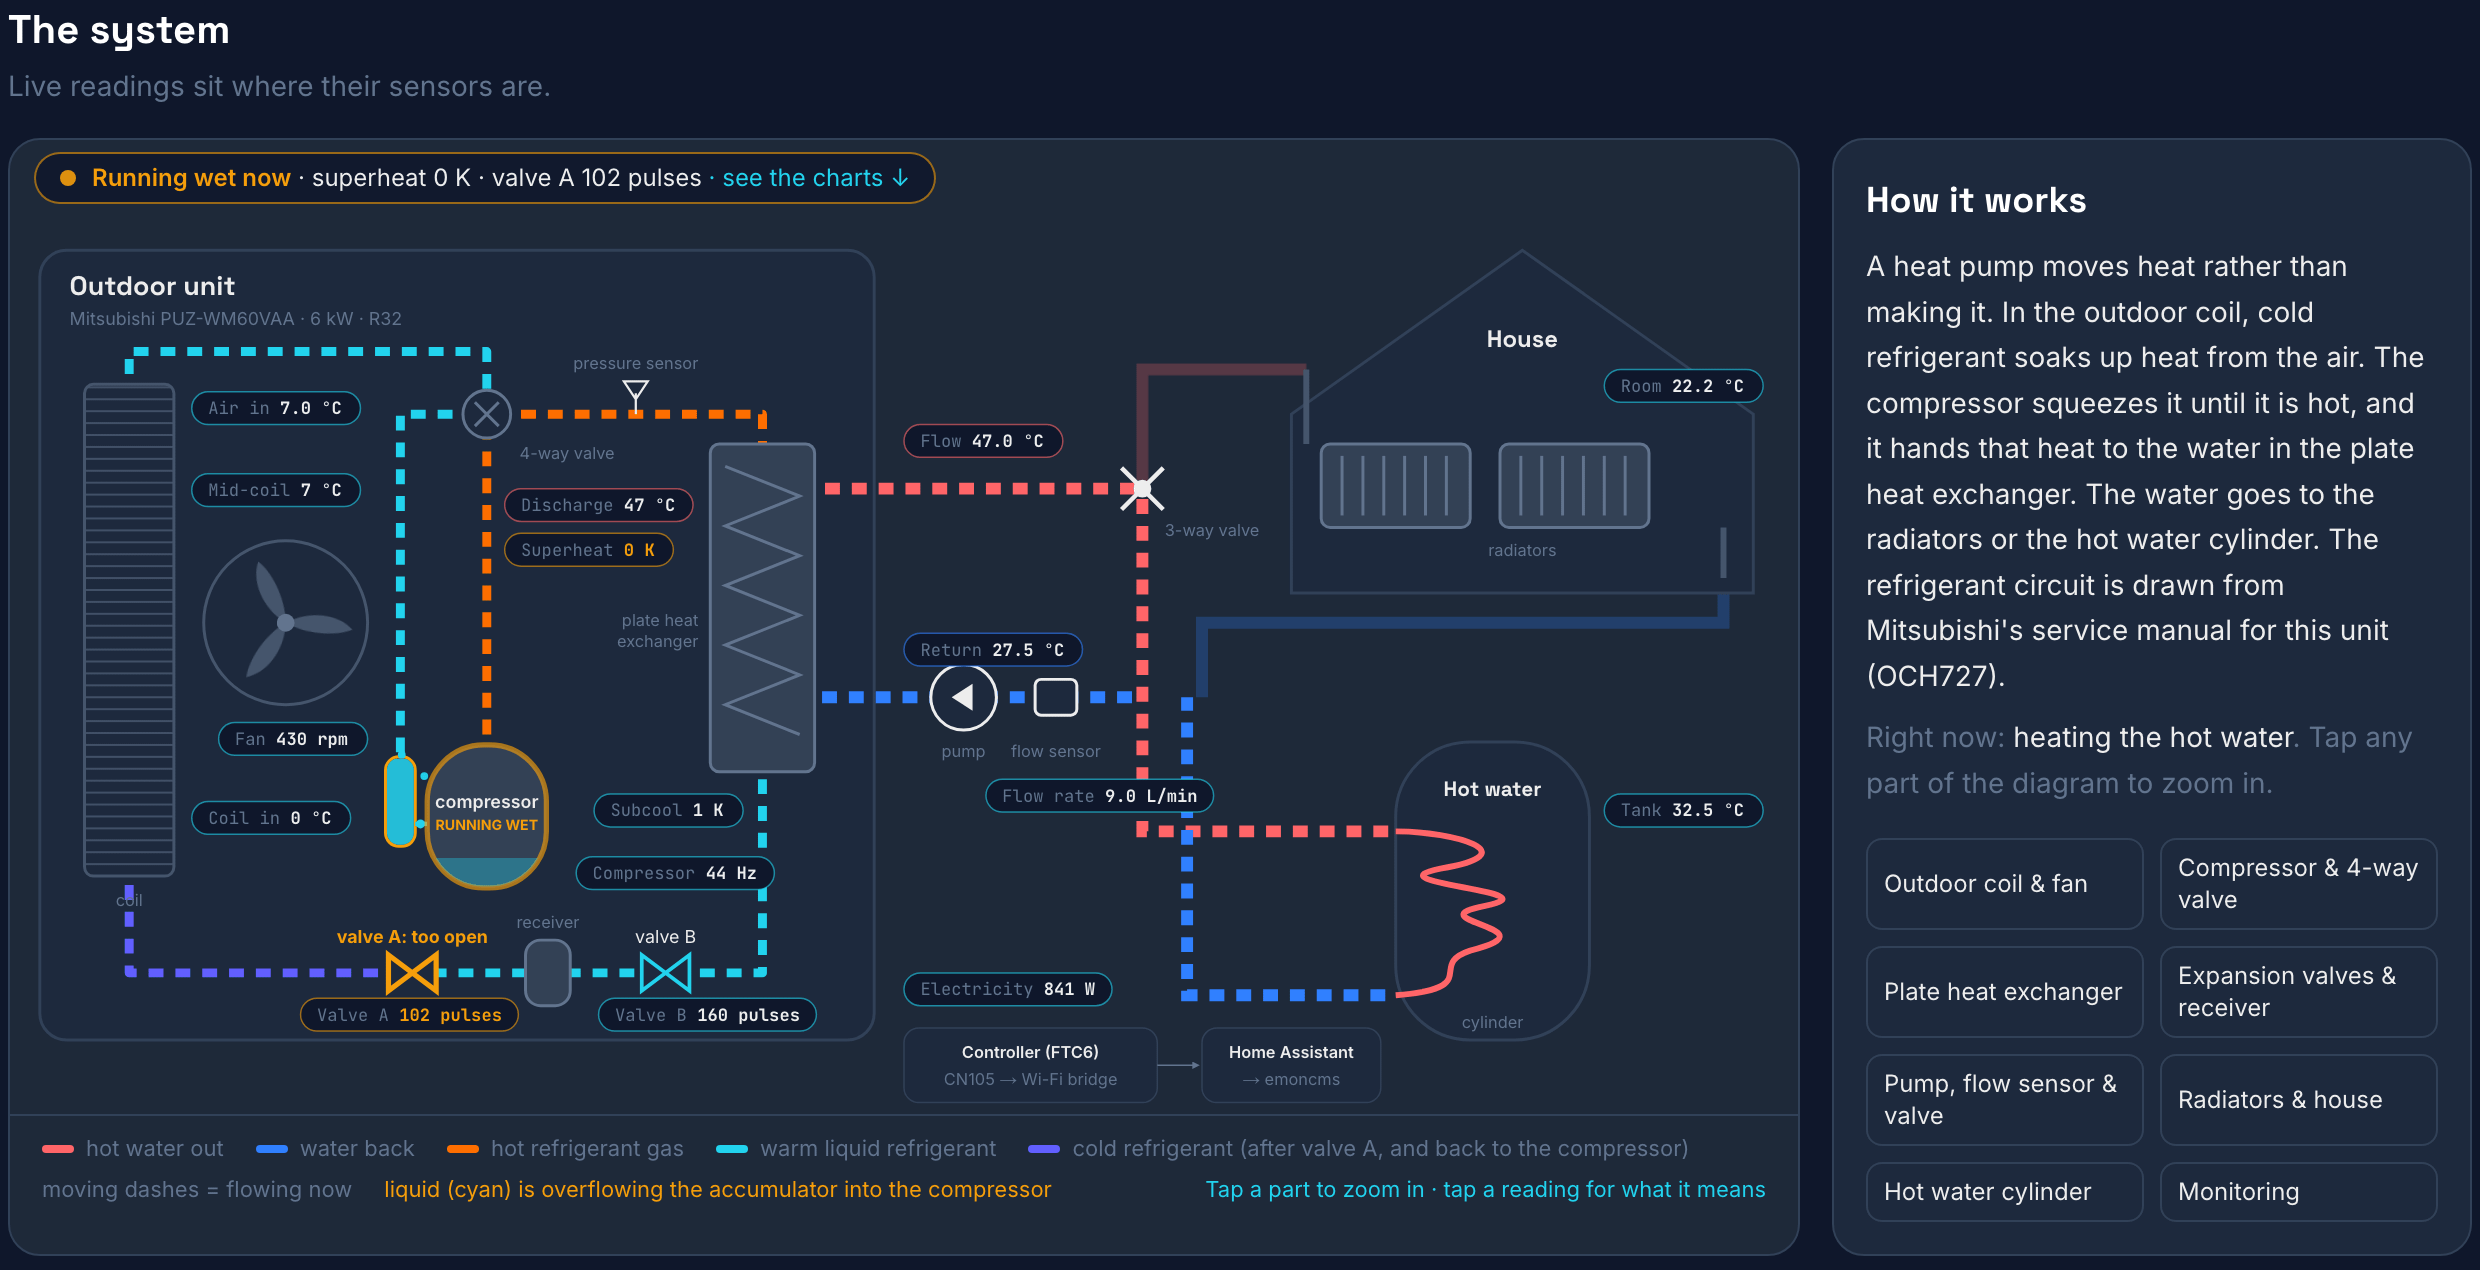
The live diagram, shown in its running-wet state: liquid (cyan) is overflowing the accumulator into the compressor, and valve A is flagged as too open.
What I wish I’d done: fitted monitoring on day one, a heat meter or a bridge like this, and published it.
5. The fault you can’t see
Taught by: John Ewbank and the OpenEnergyMonitor forum
This is where I needed help. The raw readings were overwhelming, so I sent the data to John Ewbank, a data scientist who knows heat pumps. Within a day he’d spotted that a reading called superheat kept collapsing to zero. He knew what to look for thanks to John Cantor, Andrew Fuller and Graham Hendra, and Cantor had seen the same pattern on an Ecodan of his own. On the OpenEnergyMonitor forum I found “Anyone monitoring a new R32 Ecodan?”, a thread where early owners have been comparing notes since January 2022. Some of the sharpest people who took the plunge with Mitsubishi had been down this road before me.
Here’s what should happen, in plain English (the animation at the top shows it moving):
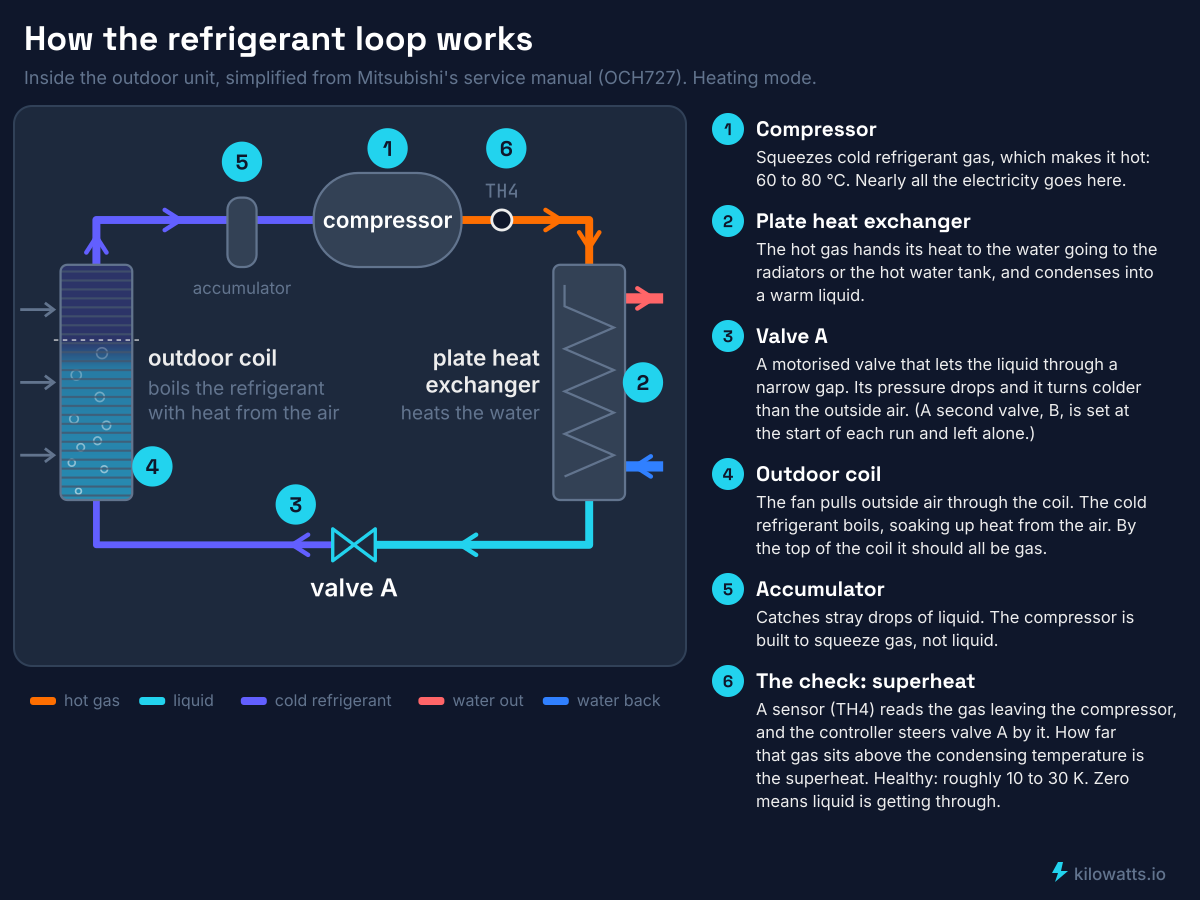
In the outdoor coil, cold liquid refrigerant soaks up heat from the air and boils into a gas.
The compressor squeezes that gas, making it much hotter.
In a heat exchanger the hot gas hands its heat to the radiator water and condenses back into liquid.
An expansion valve lets the liquid back into the coil at low pressure, and round it goes.
The valve’s job is to let in just enough refrigerant that all of it boils in the coil, so only gas reaches the compressor, a few degrees warmer than its boiling point: for R32, typically about 7 degrees, though it varies. That margin is the superheat. (Mitsubishi’s service manual doesn’t publish a target figure; the only number it gives is the alarm threshold I come to below.) My Ecodan doesn’t report this superheat directly. It reports the superheat of the gas leaving the compressor, which includes the heat of compression, so it runs higher: about 13–27 degrees on my healthy runs. Either way, zero is the warning sign. It means liquid is getting through.
Mine doesn’t. John’s tentative reading, based on the data we have so far, is that the valve doing the fine control “is too fast to open and too slow to close”. It opens too far, more refrigerant floods the coil than can boil, and liquid is carried through to the compressor. Superheat drops to zero, the compressor moves less heat for the same electricity, and it takes minutes for the valve to creep shut, before it overshoots again.
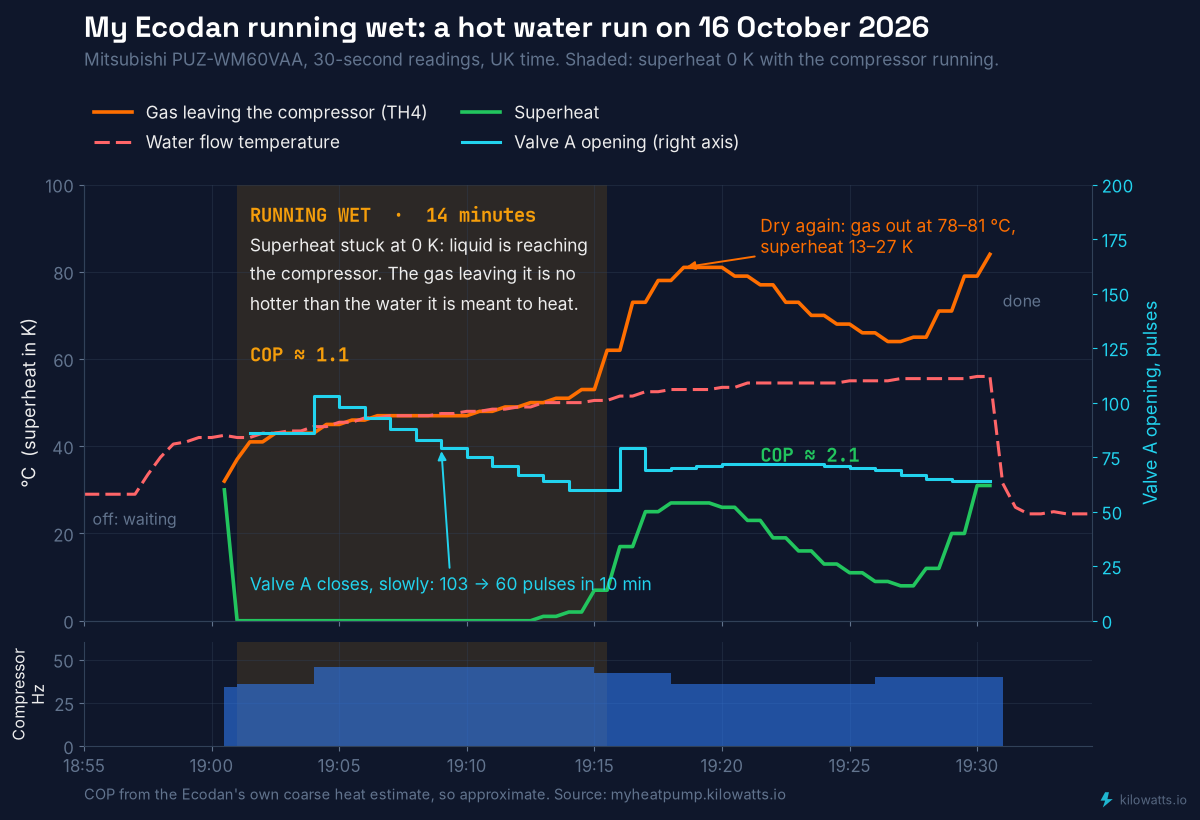
16 October, a hot water run: 14 minutes at zero superheat before the valve caught up.
On 16 October a hot water run sat at zero superheat for its first 14 minutes. While it was running wet it made about one unit of heat per unit of electricity, no better than an immersion heater; once the valve caught up, that roughly doubled. It seems worst when the unit starts from cold: the same hot water run on a 16 °C afternoon went wet for only about a minute.
Then, at 2am on 18 October, came the worst case yet, spotted by John that morning. The controller started a hot water top-up although the tank was already at its target, and that run stayed wet for all 24 minutes, at an efficiency of about 1. By the end the valve had closed as far as it does in any of my data, and it still didn’t dry out. It had started six minutes after a heating run that had itself been wet for most of its length.
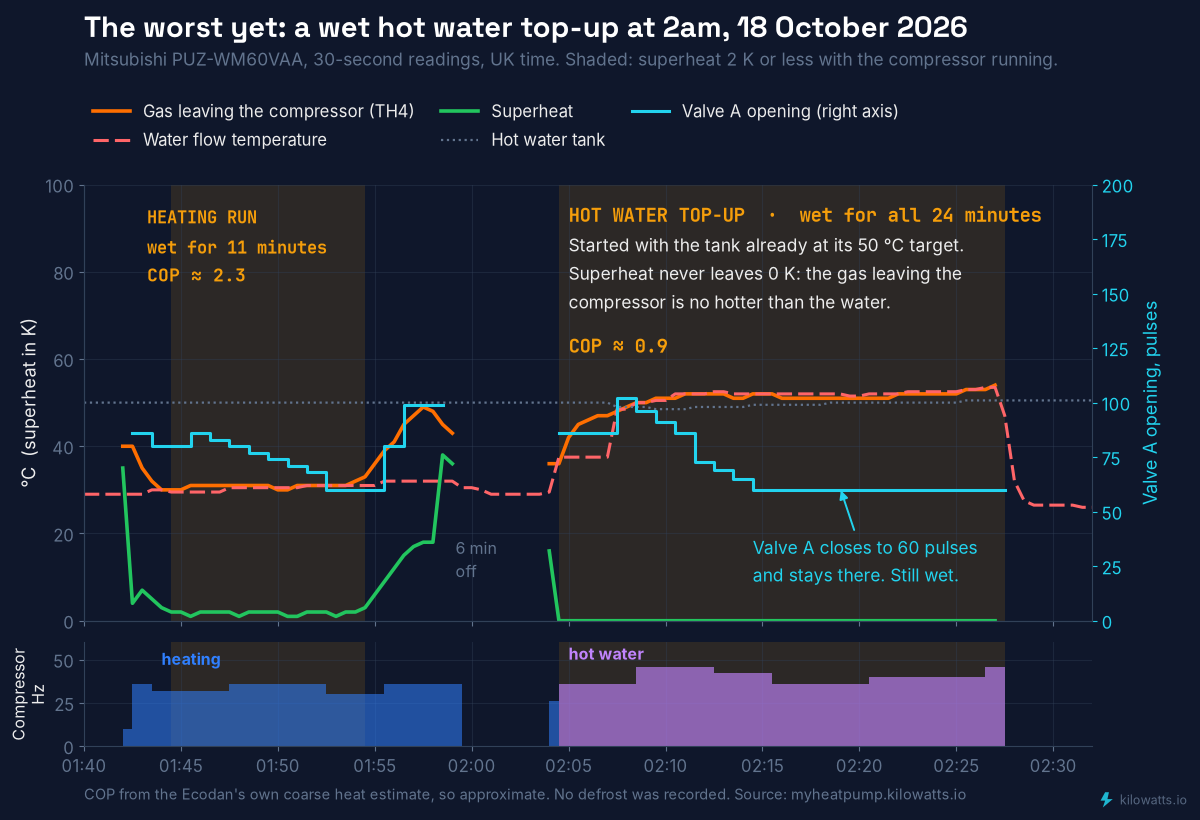
2am, 18 October: a heating run that is wet for 11 minutes, then a hot water top-up that never dries out, even with the valve closed right down.
Across 6–16 October, superheat sat at zero for about 10% of heating run time and 22% of hot water run time. What does it cost? My rough estimate is 5–10% of the heat pump’s heating electricity, about 130–260 kWh a year, perhaps half the gap in lesson 3. For me that’s only £4–8, because I pay an abnormally low 2.9p per kWh on average: I fixed my tariff before the Iran war, and a big home battery lets me buy almost all my electricity when it’s cheapest. At a typical price-cap rate of 25–30p, the same fault would cost about £30–80 a year. Not life-changing either way. The bigger worry is wear: compressors aren’t designed to swallow liquid.
My first guess was the control software in the outdoor unit, which on mine is several years old, and it’s still a suspect. But the 2am run, wet even with the valve nearly shut, makes me less sure it’s the whole story: it could also mean there’s more liquid refrigerant in the system than the valve can manage. (On a monobloc like mine the refrigerant is sealed in at the factory, so that wouldn’t be the installer’s doing.) Checking the charge is now on the list. That’s a hypothesis, not a verdict.
See it for yourself. Everything here comes from my heat pump’s live data, open to anyone at myheatpump.kilowatts.io. There’s a diagram of the whole system with live readings (it lights up when the unit is running wet), charts you can pan and zoom, automatic warnings for every wet spell, valve hunt and bout of short cycling, a replay of each one exactly as it happened, and a download of every reading. If you’re an engineer, an installer or anyone else with an idea of what’s going on or how to fix it, I’d love to hear from you. The best ideas in this story so far came from people who looked at the data and got in touch.
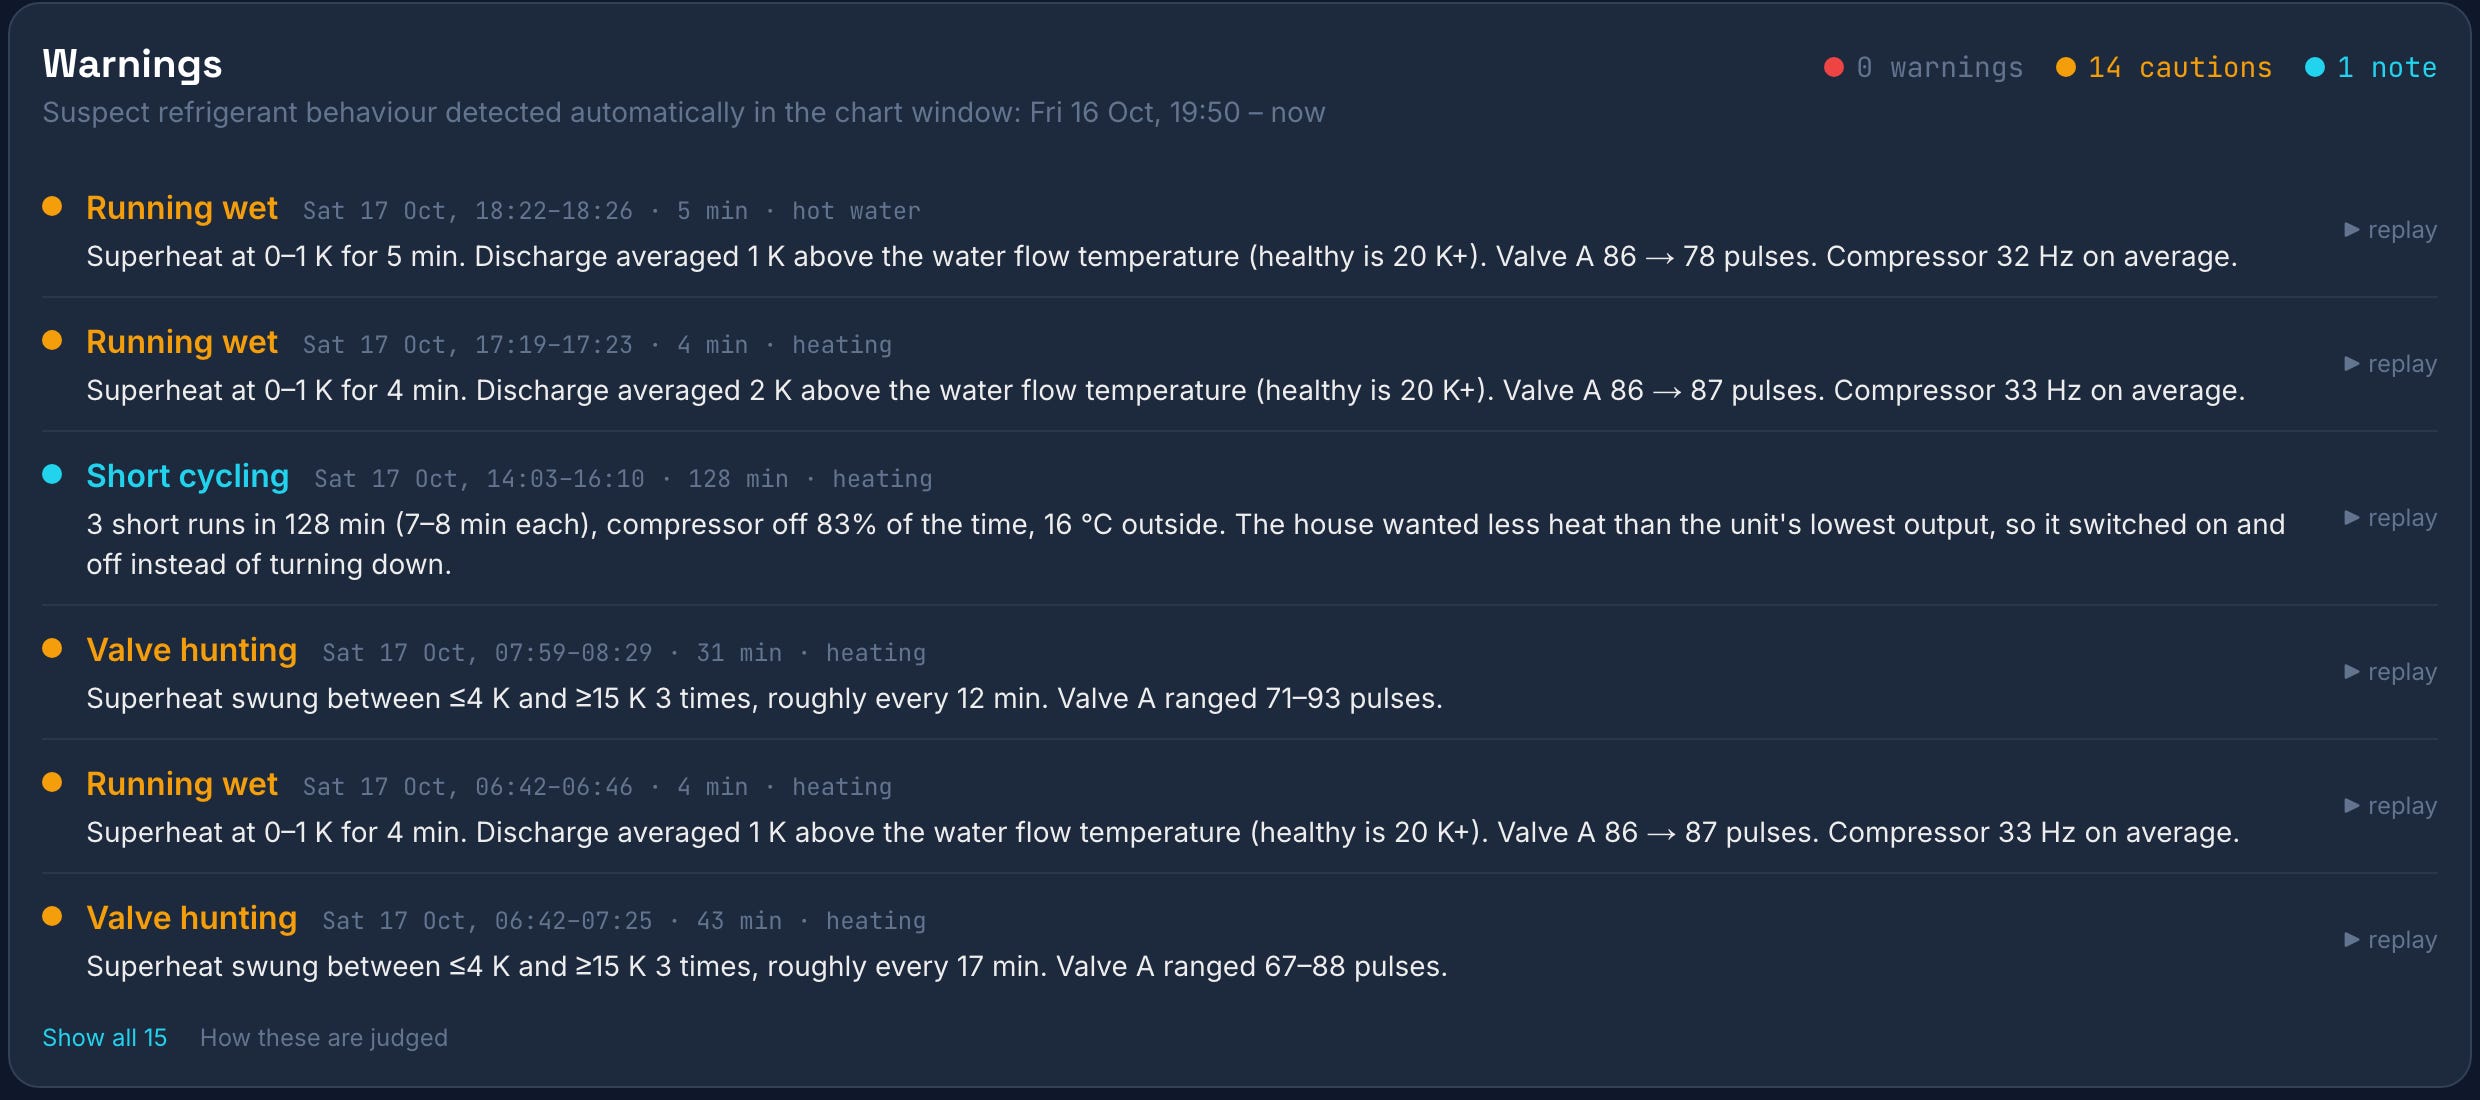
The dashboard’s automatic warnings for a single day, 17 October. Click any one to replay it.
6. A clue for installers, not a complaint about them
Taught by: John Ewbank, again
This isn’t a story about a bad installer. As John put it to me, this level of refrigerant detail goes well beyond what most installers have ever had to get their heads around. Superheat and valve positions aren’t in Mitsubishi’s app, no error code fires, and nothing in a standard service asks anyone to look. By Mitsubishi’s own definition it isn’t even a fault: the unit’s protection only trips if superheat falls to −15 degrees for three minutes, and mine has never tripped it. That’s exactly why nobody notices.
That’s exactly why it’s worth sharing. If you’re an installer who’s been called back to an Ecodan that “just isn’t as efficient as it should be”, and you’ve checked the flow temperatures, the weather compensation, the pipework and the controls and found nothing wrong, this might be the missing piece. A unit can look fine on every reading you normally check and still be quietly running wet. A bridge, or the service tool during a hot water run, shows it within minutes.
What would actually fix it?
I’d like mine fixed without it costing my installer, or me, much more time. The data-gathering is done.
When I rang Mitsubishi, I think I rather overwhelmed the person on the other end. Their usual route for a performance problem is to send out an engineer, a visit they charge £318 for, to plug in a service tool and read the unit’s operating data. I already had that data, every reading every 30 seconds for weeks, from a £35 bridge. That’s no criticism of the helpline, which simply isn’t set up for a customer who arrives with their own diagnostics. But it shows how much changes when owners can see inside their own machines.
What’s left is a short list of fairly cheap steps:
A software update. The view from the community, including some very experienced engineers, is that it might improve things but probably won’t fix them completely. It’s still the obvious first step, and done at my installer’s routine visit on 5 November it adds little to their day.
It does seem a shame, in 2026, that updating it means someone driving out with a laptop. My heat pump has been on the internet since the day it was installed. My phone, my car and my television update themselves overnight. A machine meant to run efficiently for 20 years, whose efficiency depends on its software, should be able to as well.
There’s precedent. In summer 2025 Daikin wrote to some UK owners offering a free “software enhancement”, fitted by an engineer at no charge in about 20 minutes. Owners understood it to speed up how the expansion valve reacts at low output, which is exactly where mine struggles.
Ten minutes of watching a hot water run, with the service tool or my dashboard open, to confirm what the data shows and check the refrigerant charge.
Mitsubishi’s technical team. Mitsubishi have kindly offered to take the issue to them, which is where it belongs: whether the valve’s start-up behaviour can be changed is a question only the manufacturer can answer. The evidence is already packaged up, run by run.
Meanwhile I’m trying what I can on my own, starting with the hot water, since that’s where the worst episodes happen. Home Assistant, which already runs my heating, now does two new things:
No more pointless top-ups. Once the tank has reached temperature, it lowers the target by ten degrees, so the controller has no reason to run again the way it did at 2am. If someone runs a bath, the normal target comes straight back. Over ten days, five of 29 hot water runs began with the tank already within a degree of its target.
A pause after a wet run. For 20 minutes after any run that went wet, it holds off starting the hot water. At 2am a wet heating run was followed straight away by a hot water run that never dried out, while the midnight charge, which started after a dry run, was mostly fine. Two runs make a hunch, not a finding, so the dashboard’s warnings will tell me whether the pause helps.
Neither fixes the underlying problem, but both cost nothing and should cut the worst of it.
7. You don’t need to be an engineer any more
Taught by: all of the above, and a bit of help from AI
The other thing that made this possible was AI. I used Claude to read Mitsubishi’s 87-page service manual, decode the bridge’s data and build the dashboard. It didn’t replace the people above: every time it got ahead of itself, someone like John set it straight. But it let an economist ask much better questions of the people who know.
Live with it, or push?
So where does that leave me? Honestly, torn.
One option is to accept that this might be a perfectly acceptable outcome for a heat pump, and that I’m the worried well. There’s a good case for it. It has averaged a COP of 3.3 in a draughty prefab on one of the coldest hilltops in England, and the house has never been cold. Ecodans as a breed sit comfortably mid-table. Wet spells at the start of a run are common on these units, and the fault costs me a few pounds a year on my tariff, and would cost most people tens of pounds, not hundreds. If my neighbour told me all that about their boiler, I’d tell them to stop worrying.
The other is to push: to ask Mitsubishi to acknowledge that some of these units behave like this and fix it, with software, a settings change or, if it comes to it, a replacement. Not because of the money, but because a compressor that regularly swallows liquid seems unlikely to last as long as one that doesn’t, and because if mine does this, others probably do too, mostly in homes where nobody is looking.
For now I’m taking the middle path, the cheapest one for everyone: the update at the routine visit, a few weeks of watching the dashboard’s warnings, then a decision based on what the data says. If the wet spells go away, brilliant. If not, I’ll have the clearest possible evidence to take back to Mitsubishi, collected for free.
What I do regret is not digging into any of this four and a half years ago. The data and the community were already there. I just didn’t know to look, which is the main reason I’ve written this.
Questions worth arguing about
Should manufacturers answer for how their units perform when the public has paid for them? Mine was installed with a £5,000 grant; the scheme now pays £7,500. Faults like this aren’t visible in the manufacturer’s app and aren’t part of a standard service, so who’s meant to find them? And when the fix is software, shouldn’t it arrive over the internet connection the unit already has, rather than at £318 a visit?
Is opening up this data good for heat pumps, or does it just make more worried well? My wife, a therapist, has a phrase for people who can afford to obsess over small symptoms. Are tools like AI turning heat pump owners like me into exactly that, chasing a few percent of efficiency and creating grief for installers and helpdesks? Or is opening up the data from inside heat pumps exactly what gets them performing at their potential, beating gas boilers on cost and easing the strain on the grid?
I lean towards the second, but I’d love to hear from you, especially if you’ve ever looked at your own superheat. Tell me in the comments.
Before you buy: a checklist
Look up the models you’re considering on heatpumpmonitor.org, filtered to systems like yours.
Ask about the minimum output in kW, not just the maximum, and compare it with your house’s needs on a mild day.
Resist oversizing. Ask to see the heat loss calculation.
Budget for monitoring from day one: a heat meter or, for a Mitsubishi, F1p’s CN105 bridge.
Ask whether the annual service includes software updates, and whether your installer can check refrigerant readings if performance seems low.
Ask whether it can cool as well as heat. (Here’s why.)
And if you already own a heat pump, put it on heatpumpmonitor.org. The next person choosing one will thank you.
My heat pump’s live data, warts and all, is at myheatpump.kilowatts.io. Have a look, and if you can see how to fix it, tell me.